Last update on
1. Targeted reader
This documentation is intended for the users of MicroSERVER application, allowing the visualization of data collected from SIREA automats.
2. Application overview
2.1 Dashboard widgets
The dashboard contains all the data that you deem useful to display first. These data are contained in frames called “widgets”. There are several different widgets in order to best visualize the data in different forms (table, graph, diagram…). The dashboard is easily customizable according to your needs. You can easily add, remove or move a widget.
2.2 Dashboard modes
The dashboard has to modes:
- visualization mode : this is the default mode. It allows to visualize all the widgets with their results.
- edition mode : it allows to create, modify and move widgets.
To access the visualization mode when you are in the editing mode, click on the button:

To access the edition mode when you are in the editing mode, click on the button:

These two buttons are located at the bottom right of the screen.
2.3 Widget attribute
2.3.1 Creating a new widget
To add a widget, it is necessary to be in the edition mode.
Then click on the “+ Add widget” field at the bottom of the page.
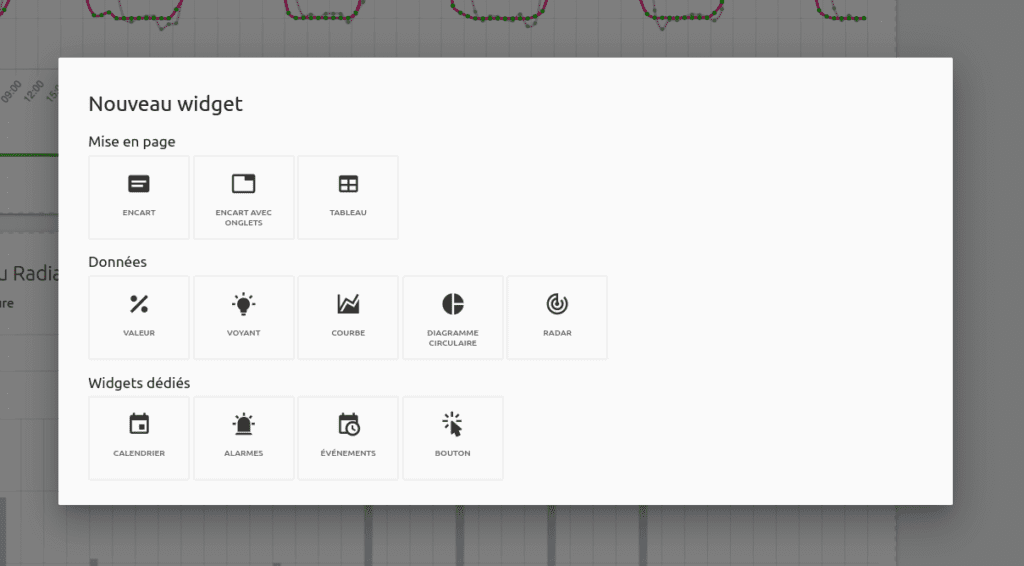
This action opens a popup window to create a new widget. Three types of widgets are proposed:
- widget Layout (“Mise en page”)
- widget Data (“Données”)
- widget Dedicated Widgets (“Widgets Dédiés”)
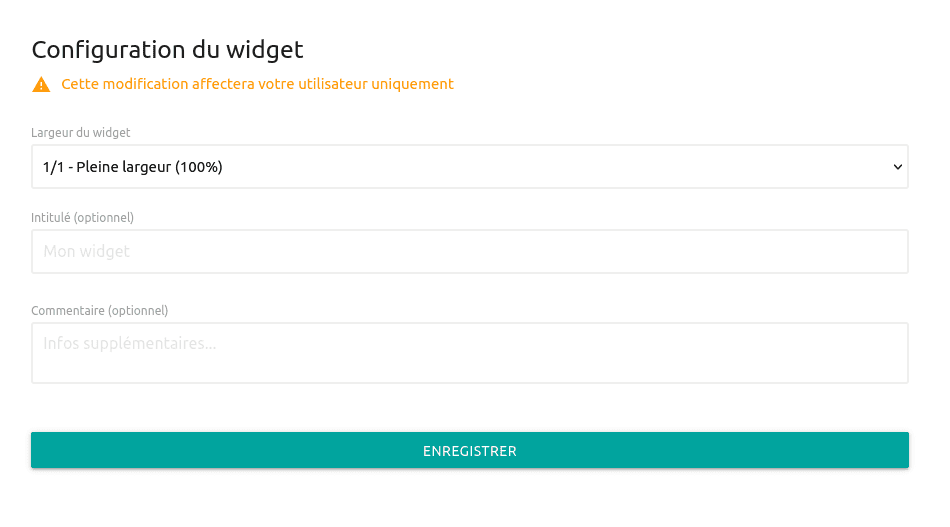
Selecting a widget will open a new popup window on the right that allows you to fill in a number of fields. Instructions for completing this window are provided in Widget Layout, Widget Data and Dedicated Widgets. Click on “Save” (“Enregistrer”) to confirm the creation. You will then go to the visualization mode.
2.3.2 Moving a widget

When a widget is created, it can be moved on the dashboard by clicking on the icon:
This icon is located at the top right of the widget and is only available in edit mode.
2.3.3 Modifying a widget

When a widget is created, it can be modified by clicking on the icon:
This icon is located at the top right of the widget and is only available in edit mode.
2.3.4 Duplicating a widget

When a widget is created, it can be duplicated by clicking on the icon:
This icon is located at the top right of the widget and is only available in edit mode.
The copy is created below the current widget.
2.3.5 Deleting a widget

When a widget is created, it can be deleted by clicking on the icon:
This icon is located at the top right of the widget and is only available in edit mode. This action is irreversible.
2.4 Layout widgets

2.4.1 Insert widget
This widget allows you to create a frame (white) in which you can create other widgets. The purpose is that the Insert serves as a frame in which we will insert widgets such as photos. In the Insert, the widgets will be able to move to different places.
The default width of the widget is 1/1 – Full width (100%). It is possible to decrease it by selecting another width from the following list:
- ¼ – Quarter-width(25%)
- ⅓ – Third of a width (33%)
- ½ – Half-width (50%)
- ⅔ – Two thirds of the width(67%)
- ¾ – Three quarter-width (75%)
You can add a title to the Insert and a comment by filling in the two optional forms.

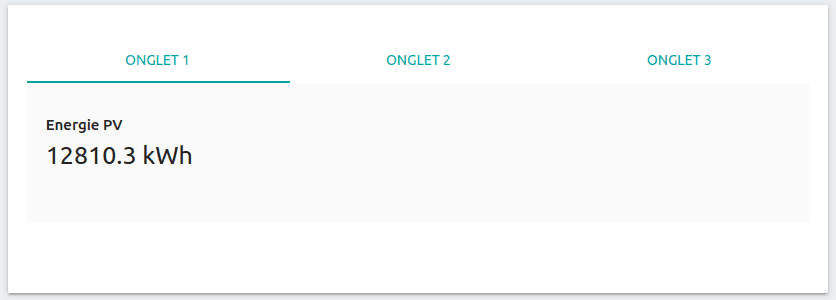
2.4.2 Insert widget with tabs
CREATION AND MODIFICATION
This widget allows you to create a frame (white) in which you can create other widgets. The purpose is that the Insert serves as a frame in which we will insert widgets such as photos. In the Insert, the widgets will be able to move to different places.
The default width of the widget is 1/1 – Full width (100%). It is possible to decrease it by selecting another width from the following list:
- ¼ – Quarter-width(25%)
- ⅓ – Third of a width (33%)
- ½ – Half-width (50%)
- ⅔ – Two thirds of the width(67%)
- ¾ – Three quarter-width (75%)
You can add a title to the Insert and a comment by filling in the two optional forms.
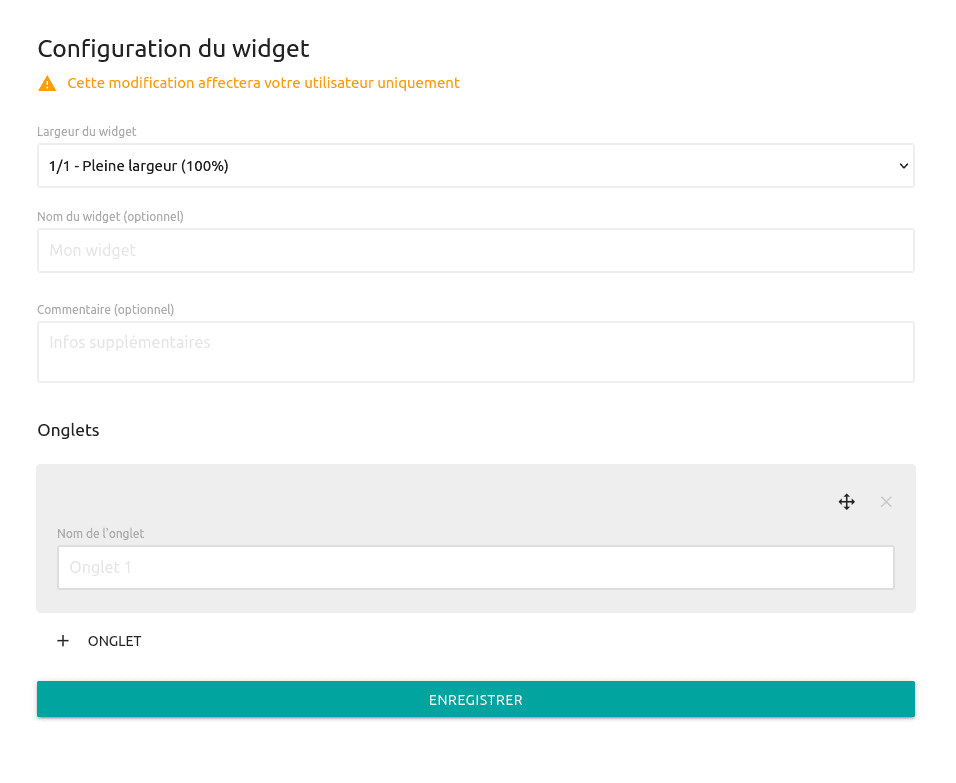
To create a tab, you just have to fill in the “Name of the tab” “(Nom de l’onglet”) in the part “Tabs” (“Onglets”) in the grey frame.
If you want to add a new tab, click on “+ ONGLET”
A new grey frame appears. It is to be filled in like the previous one.

If you want to delete a tab, click on the cross at the top of the grey frame of the tab concerned. You can only delete a tab if there are more than two of them.
Navigation in the widget
In the visualization mode, you can change tabs by clicking on the desired tab.

2.4.3 Table widget
This widget is used to create and view a table. Several types of tables are already pre-configured but we have the possibility to customize our own tables according to our needs.
“Appearence” TAB (“APPARENCE”)
This tab allows you to configure the general appearance of the widget and its header.
The default width of the widget is 1/1 – Full width (100%). It is possible to decrease it by selecting another width from the following list:
- ¼ – Quarter-width(25%)
- ⅓ – Third of a width (33%)
- ½ – Half-width (50%)
- ⅔ – Two thirds of the width(67%)
- ¾ – Three quarter-width (75%)
You can add a title to the Insert and a comment by filling in the two optional forms.
“DATA” TAB (“Données”)
The table can display different information depending on the type of content required. By clicking on the “Content type” field, you can choose between information on:
- the calendar
- user accounts
- the equipment
- the procedures
- user profiles
- deferrals
- the variables
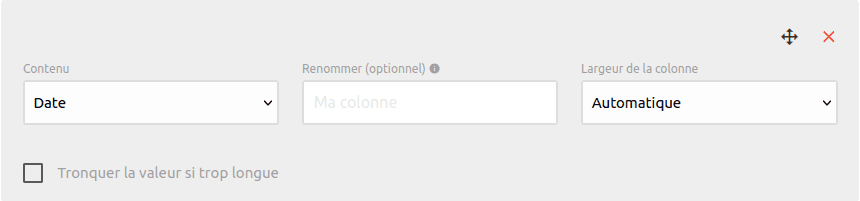
Once the content type has been selected, the default columns of the table are displayed. A column is represented in a grey box as shown in the example:
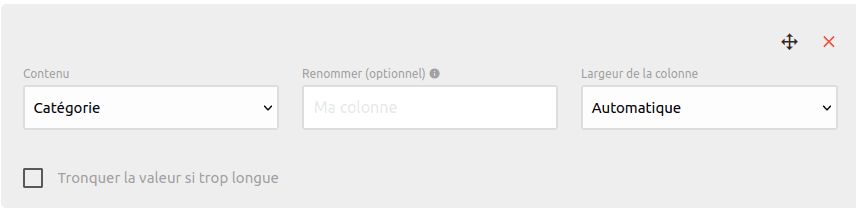
The name of the column is written in the “Content” (“Contenu”) field. Another column can be selected from the drop-down menu.
Warning
If a new column is selected then it may already be selected further down. It is therefore very important to view all the columns so that you do not end up with the same column twice or more.
By filling in the “Rename” (“Renommer”), field, you rename the name of the column. This action is optional and by default the name of the column will be the one entered in the “Content” (“Contenu”) field.
It is also possible to choose the size of the column width. By default, the column size will be adjusted automatically but it can be changed by clicking on “Column Width” (“Largeur de la Colonne”). It can be set like this:
- small (10%)
- medium (25%)
- large (50%)
By checking, “Truncate value if too long” then the table will display truncated variables whose number of significant digits will depend on the size of the widget.

To delete the column, click on the red cross at the top right.

To change the order of the columns, click on the button at the top right corner and then drag the column to the desired location.

To add a column, click on the button
+ COLONNE. A new grey insert to be completed appears.
For each type of content, there are default columns and additional columns available (see table below).
| Type of content | Default columns | Available columns |
|---|---|---|
| Calendar | – Category – Equipment – Variable – Comment – Start date – End date – Start value – Return value – Occurrence | – Category of the variable |
| User accounts | – Heading – Commentary – Profile | – Activated – Regional format – Email address – Phone number – Zones filter – Equipment filter – Availability period – Unavailability period |
| Equipment | – Index – Type – Heading – Zones – Communication status – Alarms | – Enabled – Comment – Timeout (in seconds) – Refresh time (in seconds) – Communication protocol – Communication port – Slave number |
| Procedures | – Title – Comment – Related variables – Run at startup – Run periodically | – Days of the week – Days of the month – Months – Hours – Minutes – Seconds – Code |
| User profiles | – Title – Comment – Can administer the system – Can manage users | – Category filter – Can refresh equipment – Can force variables – Can acknowledge alarms |
| Deferrals | – Title – Comment – Type | – Recipient – Sent on alarm – Subject on alarm – Message on alarm – Send on alarm stop – Subject on alarm stop – Message on alarm stop – Zones filter – Equipment filter – Filter categories – Filter variable types |
| Variables | – Equipment – Address – Mnemonic – Label – Value – Last change | – Type – Register – Comment – Internal – Public – Forcible – Priority – Min. forcing value – Max. forcing value – Categories – Format – Accuracy – Min. gross value – Max. gross value – Min. scaled value – Max. scaled value – Generate alarms – Alarm label – Alarm condition – Generate events – Events label – Events condition – Historical values – Averaging curve – Delay between two points (in seconds) – Hysteresis |
Information
To create the table you want, you have to modify the default columns, add new columns or delete some according to the indications explained above.
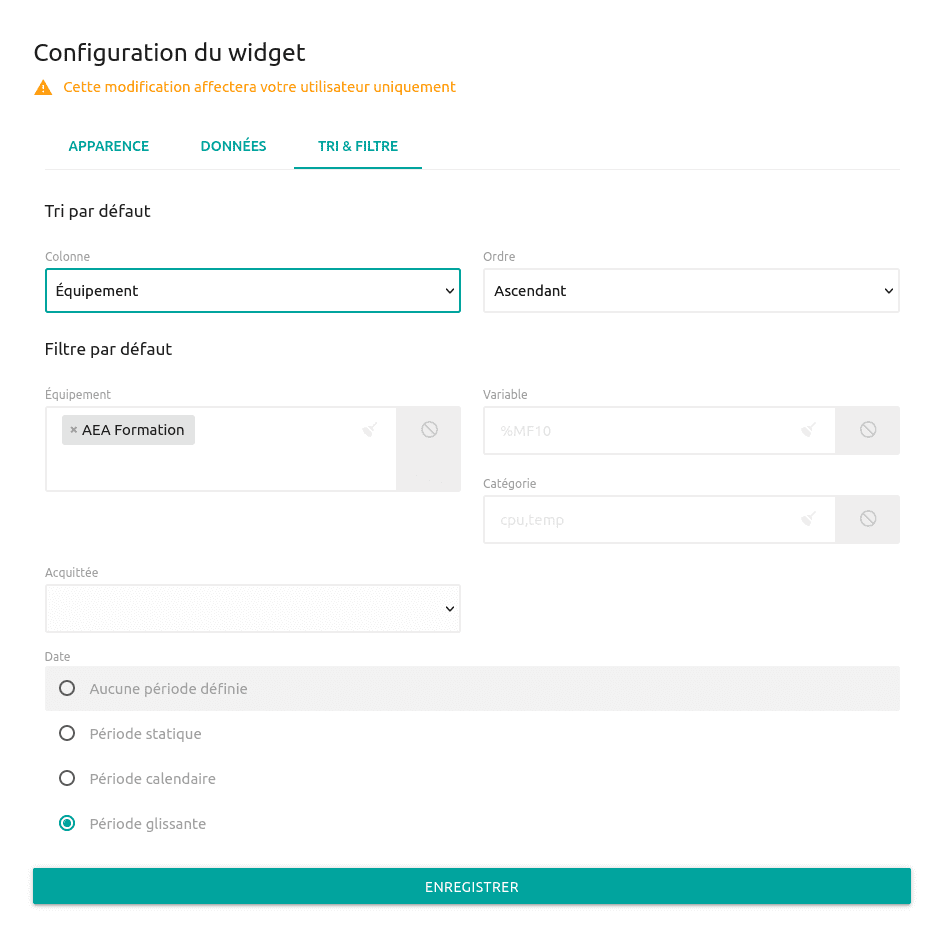
Sort & filter tab (“Tri & filtre”)
default sorting
To visualize the table, it is necessary to select a column (from the Column drop-down menu) whose elements will be sorted either in ascending or descending order (from the Order drop-down menu).
dEfauLt filter
If you wish to visualize specific items, you can filter by selecting the filter attribute(s) of a column. It is entirely possible to filter on one or more columns.
An attribute can be deleted by clicking on the cross to the left of it (on the attribute itself) (e.g. to delete the “AEA Formation” attribute, click on the cross to the left of it).
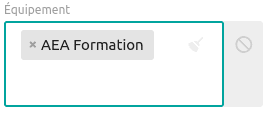
To exclude a filter on a column, click on the button :
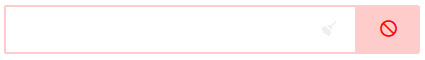
The column box is then circled in red.

To clear a filter of all its attributes, click on the broom icon to the right of the filtered box.
For each type of content, you can filter on different columns (see table below).
| Content | Filter by column(s) |
|---|---|
| Calendar | – Category – Equipment – Variable |
| User accounts | – Title – Activated – Comment – Profile – Regional format – Email address – Phone number – Zones filter – Equipments filter |
| Equipments | – Index – Type – Heading – Zones – Enabled – Comment – Timeout (in seconds) – Refresh time (in seconds) – Communication protocol – Communication port – Slave number |
| Procedures | – Title – Comment – Related variables – Run at startup – Run periodically – Days of the week – Days of the month – Months – Hours – Minutes – Seconds – Code |
| User profiles | – Title – Comment – Can administer the system – Can manage users – Category filter – Can refresh equipment – Can force variables – Can acknowledge alarms |
| Deferrals | – Title – Comment – Type – Recipient – Sent on alarm – Subject on alarm – Message on alarm – Send on alarm stop – Subject on alarm stop – Message on alarm stop – Zones filter – Equipment filter – Filter categories – Filter variable types |
| Variables | – Equipment – Address – Mnemonic – Label – Value – Category |
Table of columns that can be filtered according to the type of content
2.5 Data widget

2.5.1 Value widget
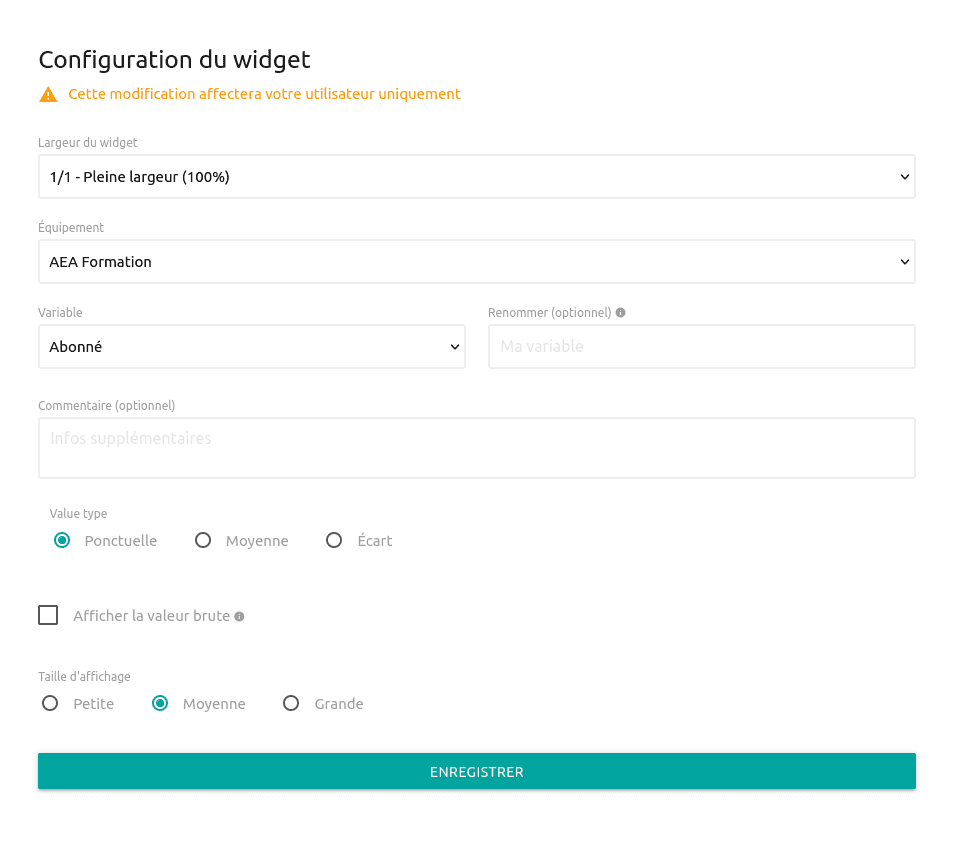
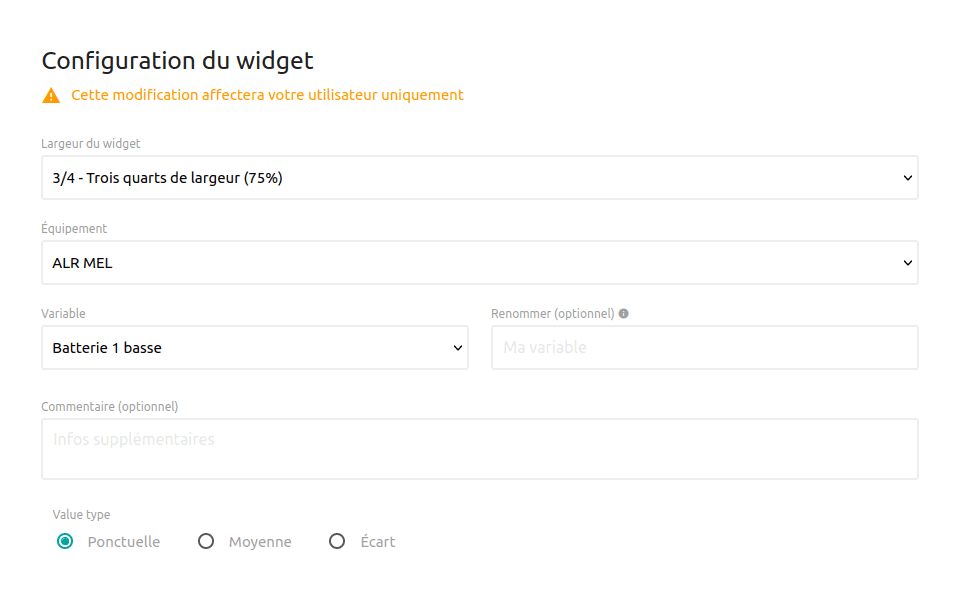
The value widget allows you to visualize the value of a variable at a given time.
The default width of the widget is 1/1 – Full width (100%). It can be reduced by selecting another width from the following list:
- ¼ – Quarter-width (25%)
- ⅓ – Third of a width (33%)
- ½ – Half width (50%)
- ⅔ – Third of a width (67%)
- ¾ – Three quarters-width (75%)
To choose the desired variable, you must first select the equipment and the name of the variable in the drop-down menu. It is also possible to rename the variable by another name and to add a comment.
The “Type of value” (“Type de valeur”) field allows you to choose which type of value you wish to have among three options:
- If you want a point value (instantaneous), click on “point” (“ponctuelle”).
- If you want an averaged value, click on “average” (“moyenne”). New time information is then requested. You have the choice to calculate the average over:
– a static period. A time interval with a start and end date is then to be filled in – a calendar period. Depending on the chosen period, if you click on previous, then the interval will extend from the previous hour, day, week, month or year to the current date. Depending on the period chosen, if you click on current, then the average will be calculated over the current hour, day, week, month or year. By default the period is the current day. – a sliding period. Depending on the length of time N entered and the period, the time interval will extend over the last N hour(s), day(s), week(s), month(s) or year(s)
- If you want a difference between two values, click on “gap” (“écart”). New time information is then requested. This gives you the option of calculating the difference between two values on:
– a static period. The difference will be calculated between the end date and the start date entered.
– a calendar period. Depending on the chosen period, if you click on current/previous, then the difference will be calculated between the ” current/previous ” (“actuelle/précédente”) hour, day, week, month or year and the current date. By default, the date will be the current day.
– a rolling period. The difference will then be calculated between the current date and the last N hour, day, week, month or year
By default, the graph will display a point value.
If required, the gross value can be displayed by checking “Display gross value” (“Afficher la valeur brute”). However, the unit will not be displayed.
The size of the display is adjustable as the font size decreases when you click on the small size. It increases if you click on “Medium” and is the maximum size if you click on “Large”. By default the size is set to “Medium”.

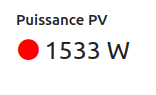
2.5.2 Indicator widget
The indicator widget allows you to see if the value of a variable respects one or more conditions thanks to a coloured indicator.
The default width of the widget is 1/1 – Full width (100%). It can be reduced by selecting another width from the following list:
- ¼ – Quarter width (25%)
- ⅓ – Third of a width (33%)
- ½ – Half width (50%)
- ⅔ – Third of a width (67%)
- ¾ – Three quarters of a width (75%)
To choose the desired variable, you must first select the equipment and the name of the variable in the drop-down menu. It is also possible to rename the variable by another name and to add a comment.
The “Type of value” (“Type de valeur”) field allows you to choose which type of value you wish to have among three options:
- If you want a point value (instantaneous), click on “point” (“ponctuelle”).
- If you want an averaged value, click on “average” (“moyenne”). New time information is then requested. You have the choice to calculate the average over:
– a static period. A time interval with a start and end date is then to be filled in – a calendar period. Depending on the chosen period, if you click on previous, then the interval will extend from the previous hour, day, week, month or year to the current date. Depending on the period chosen, if you click on current, then the average will be calculated over the current hour, day, week, month or year. By default the period is the current day. – a sliding period. Depending on the length of time N entered and the period, the time interval will extend over the last N hour(s), day(s), week(s), month(s) or year(s)
- If you want a difference between two values, click on “gap” (“écart”). New time information is then requested. This gives you the option of calculating the difference between two values on:
– a static period. The difference will be calculated between the end date and the start date entered.
– a calendar period. Depending on the chosen period, if you click on current/previous, then the difference will be calculated between the ” current/previous ” (“actuelle/précédente”) hour, day, week, month or year and the current date. By default, the date will be the current day.
– a rolling period. The difference will then be calculated between the current date and the last N hour, day, week, month or year
By default, the graph will display a point value.
The “Conditions” section is used to set the conditions that will raise an alarm if they are validated.
The condition is constructed as follows:
variable OPERATOR_LOGICAL value
The variable corresponds to the one entered above. To create a condition, the grey box must be filled in by first choosing the logical operator from among:
- Is equal to (==)
- Does not equal (!=)
- Is less than or equal to (<=)
- Is strictly less than (<)
- Is greater than or equal to (>=)
- Is strictly greater than (>)
The default logical operator is “Is equal to” (==).
Finally, fill in the “Value” (“Valeur”) field. The value written in this box will correspond to the value of which the variable will be either equal, not equal, less than or equal to, strictly less than, greater than or equal to or strictly greater than.
By clicking on the field “Light colour” (“Couleur du voyant”), it is possible to change the colour of the light using a colour selector. The hexadecimal value of the desired colour can also be entered directly. The light will have this colour as long as the condition is not verified. By default the colour is blue ().
If the condition is verified, a text can be displayed instead of the value of the variable. The desired text must then be written in the “Text to be displayed” (“Texte à afficher”) field. If this field is left empty, the original value will be displayed.
At the bottom of the grey box on the right, the “Display raw value” (“Afficher la valeur brute”) field is used, if checked, to display the raw value of the variable without units.
Below the insert, the colour of the light when the condition is checked can be modified by clicking on the corresponding field. By default, the colour is red.
On the right, always if the condition is verified, a text can be displayed instead of the value of the variable. The desired text must then be written in the “Text to be displayed” (“Texte à afficher”) field. If this field is left empty, the original value will be displayed.
The Show raw value field is used, if checked, to display the raw value of the variable without units.
At the moment we have only one condition. If you wish to add other conditions, click on “+ CONDITION”. A new grey box is then displayed. It is to be filled in like the previous one explained above.
Thus the light will change colour when condition1 AND condition2 are true. If there are three conditions, the light will change colour when condition1 AND condition2 AND condition3 are true, etc.
The size of the display is adjustable as the font size decreases if you click on the small size. It increases if you click on “Medium” (“Moyenne”) and is the maximum size if you click on “Large” (“Grande”). By default the size is set to “Medium” (“Moyenne”).


2.5.3 Curve widget
The curve widget provides an overview of the evolution of the values of a variable in the form of a curve. Thepopup window of this widget consists of three tabs:
- the “Appearance” tab (“Apparence”)
- the “Data” tab (“Données”)
- the “Prediction” tab (“Prédiction”)
Appearance tab
This tab allows you to configure the general appearance of the widget and its header. The default width of the widget is 1/1 – Full width (100%). It can be reduced by selecting another width from the following list:
- ¼ – Quarter width (25%)
- ⅓ – Third of a width (33%)
- ½ – Half width (50%)
- ⅔ – Third of a width (67%)
- ¾ – Three quarters of a width (75%)
You can add a title to the graph and a comment by filling in the two optional forms. Checking “Enable navigation from widget” (“Activer la navigation depuis le widget”) unlocks the functionality of changing the start and end dates on the widget in the visualization mode.

“DATA” tab
This tab allows you to configure the characteristics of the desired graph.
The “Time period” section (“Temporalité”) allows you to select the type of time period you want from three available options:
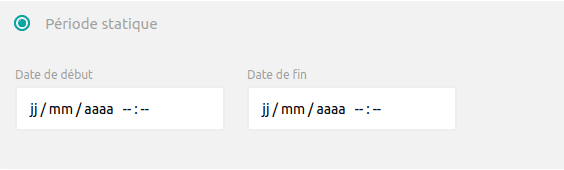
- “Static period” (“Période statique”) defines a display time interval. A start and end date must be entered.
- “Calendar period” (“Période calendaire”) defines a time interval for displaying data from the current or previous date. You can choose to display data for the previous or current hour, day, week, month or year by selecting the desired period and offset from the drop-down menu. By default the period is the current day.

- “Rolling period” (“Période glissante”) defines a time interval from the last hour(s)/day(s)/week(s)/month to the current date. To do this, simply enter a duration and a period type in the drop-down menu. By default, the period is from yesterday to today.

After choosing a period, the precision of the points can be modified. This precision corresponds to the time difference between two points displayed on the graph. By default, this difference is one hour.

Warning
The longer the period chosen with a small precision, the longer the time it takes for the curve to build up and be displayed.
The “Variables” part allows you to choose the variables that you wish to display the values.
By default, only one variable is displayed on the widget. A variable and its characteristics are in a grey box.
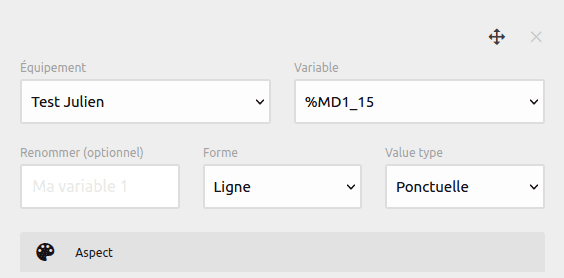
Pour choisir la variable, sélectionner son équipement et son nom dans les menus déroulants prévus à cet effet. Il est aussi possible de renommer la variable.
Depending on the values you have and the use you want to make of them, two graph shapes are available in the Shape field:
- line graph. An example of an online graph is shown below:
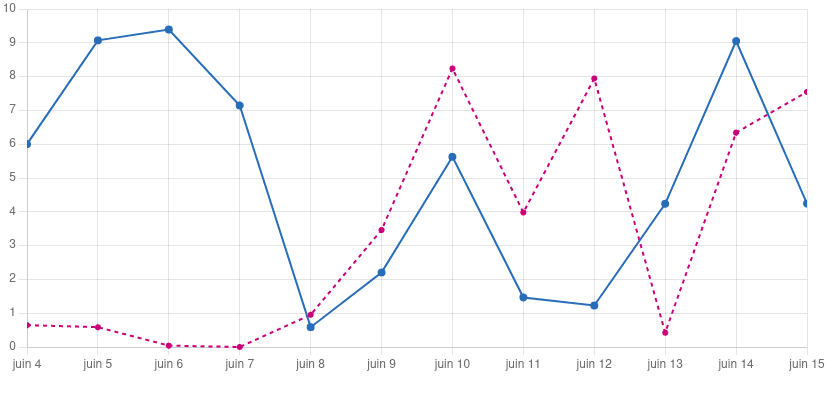
- Bar graph. An example of a bar graph is shown below:
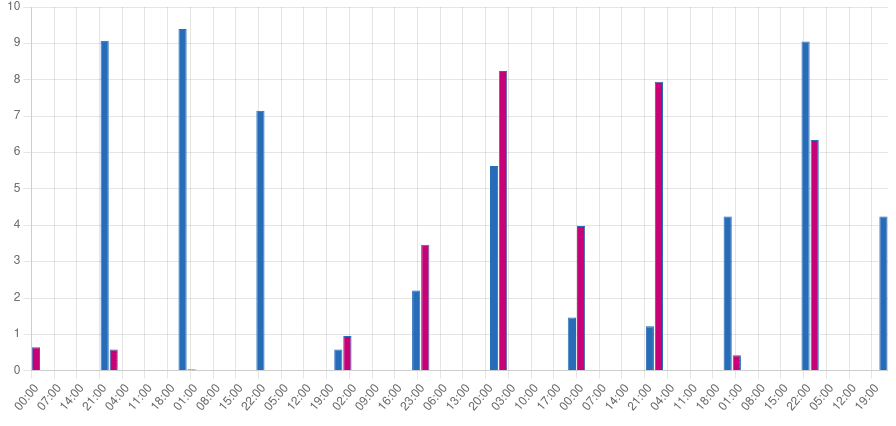
Avertissement
Il est possible de combiner graphe en ligne et graphe en barre mais il faut faire attention à l’échelle qui risque de ne pas être la même.
The “Type of value” (“Type de valeur”) section allows you to choose which type of value you wish to have for each point from three options:
- if you want a point value (value of the moment), click on “point” (“ponctuelle”).
- if you want an averaged value (average calculated between two points), click on “average” (“moyenne”).
- if you want a difference between two values (difference between the current point and the previous point), click on “gap” (“écart”).
By default, the graph will display point values.
Finally, you can choose how the values of the variable will look on the graph. If we have an line graph, the “Aspect” part contains six modifiable characteristics:
- the main colour. If you click on this field, you can change the colour to another. The default colour is blue ().
- the thickness of the line. This value ranges from 1 to 4 for a thin to thick line. The default thickness is 1.
- the field “Dotted line” (“Trait en pointillé”). If this field is checked then the line of the curve will be dotted. By default the field is unchecked.
- the colour of the dot. If you click on this box, you can change the colour to another. The default colour of the dot is blue ().
- the width of the stitch. This value is between 1 and 7, where 1 is the smallest stitch and 7 is the largest. The default width is 3.
- the shape of the stitch. Ten shapes are available (round, plus, cross, stroke, line, square, rounded square, diamond, star and triangle). By default the point is round.

If we have a bar graph, the “Aspect” part contains three modifiable characteristics:
- the main colour. If you click on this field, you can change the colour to another. The default colour is blue ()
- the colour of the outline. If you click on this field, you can change the colour to another. The default colour is blue ()
- the width of the contour. This value is between 1 and 4, with 1 being the thinnest outline and 4 being the thickest. The default width is 1.
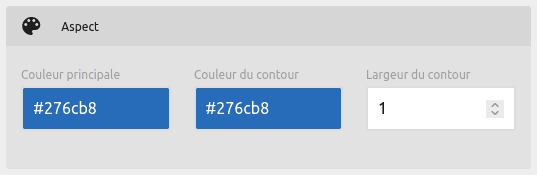
Information
Note that the colour in hexadecimal can be written in the colour boxes.
“Prediction” tab
This tab includes an advanced feature of the curve widget: prediction. Thanks to the NeurEco software developed by Adagos, we will be able to create an artificial intelligence model that will predict the values of the variables requested in the “Data” (“Données”) tab. These values will depend on the parameters entered in the “Prediction” (“Prédiction”)tab.
The “Enable prediction” (“Activer la prédiction”) button unlocks the model generation features on the widget as well as this information in the visualization mode. In addition, if the model has been generated then the predicted curves and/or bars will be displayed in addition to the actual curves.
The “Meteorological data” (“Données météorologiques”) section allows you to select which meteorological parameters you want our model to take into account when generating the model. The selectable parameters are:
- solar radiation
- the actual air temperature
- cloud cover
- the humidity of the air
- wind speed
- wind direction
- the duration of sunshine
- rainfall
In this part, we are also asked to fill in the field “Postal address” (“Adresse postale”) as well as the geographical coordinates with the latitude and longitude where the data was collected.
The “Learning period” (“Période d’apprentissage”) allows you to select the period on which the algorithm will base itself to learn and build the model. There are 4 choices:
- “No period defined” (“Aucune période définie”). The period will then be from the first day of data collection to the present.
- “Static period” (“Période statique”) defines a display time interval. A start and end date must be entered
- “Calendar period” (“Période calendaire”) defines a time interval for displaying data from the current or previous date. You can choose to display data for the previous or current hour, day, week, month or year by selecting the desired period and offset from the drop-down menu. By default the period will be the current day.
- “Rolling period” (“Période glissante”) defines a time interval from the last hour(s)/day(s)/week(s)/month to the current date. To do this, simply enter a duration and a period type in the drop-down menu. By default, the period will be from yesterday to today
Below the choice of the period, one can decide on the precision of the points in a drop-down menu. The precision is either hourly, daily, weekly or monthly, knowing that a certain quantity of points is required for the model to be reliable. This quantity varies according to the data we have. By default the precision is to the hour.
The “Prediction period” (“Période de la prédiction”) part allows you to select the period over which you wish to have a prediction. To do this, simply increment and decrement the duration and choose a period from among next hour(s), next day(s), next week(s), next month(s), next year(s). This period will be added to the display period that you have already defined in the “Data” (“Données”) tab.
Warning
The generation time of a model can take a long time depending on the amount of past data. For example, it is normal that for a two-year period with hourly accuracy combined with several weather parameters, the model takes more than an hour to generate.
Navigation sur le widget
general features
Une fois que l’on a cliqué sur le bouton “Enregistrer”, on peut observer notre widget Courbe.
Information
If you only want to view the values of one or more variables, you will only complete the "Appearance" and "Data" ("Apparence", "Données") tabs and then click Save.
Pour zoomer sur une partie du graphe, cliquez sur la zone du graphe que l’on veut agrandir.
If the “Enable widget navigation” (“Activer la navigation sur le widget “) field has been ticked then you can change the display period of the curve by changing the dates in the “Start date” (“Date de début”) and “End date” (“Date de fin”) fields and then clicking on “Apply” (“Appliquer”).

On the widget, it is possible to view the date of the last variation of the variable at the bottom left of the widget.
Features specific to prediction
If you have also filled in the “Prediction” (“Prédiction”) tab, then you can first generate a model by clicking on the “Generate model” (“Générer un modèle”) button
The generation of a model can take some time depending on the amount of data given as parameters. The progress of the model generation can be followed with the progress bar at the bottom of the widget. Several states of progress are possible:
- Sending data for training
- Model generation
- Training completed
If a model has not yet been generated, the information “Training not started” (“Apprentissage non démarré”) is displayed
In addition, some errors can be removed when creating the model:
- Communication error with the prediction server
The generation of the model will then be interrupted.
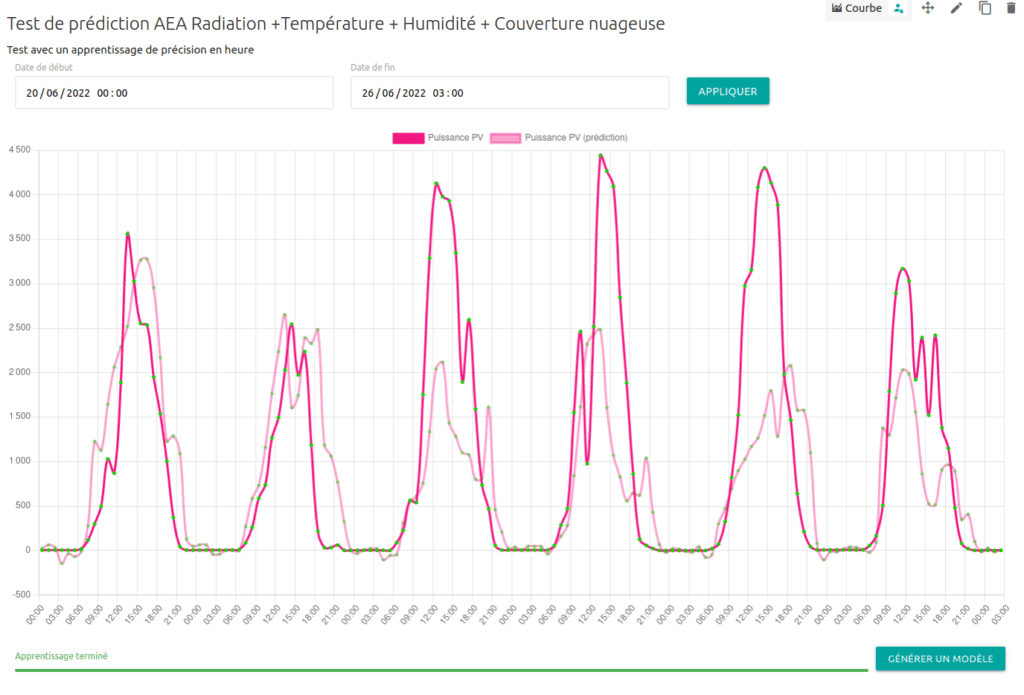
When the generation has been successful, we can see that the predicted curve is displayed on the widget (lighter in colour than the actual curve). We can then check if our model is correct or not depending on whether the real curve and the predicted curve overlap (if the period is in the past).

2.5.4 Diagram widget
The default width of the widget is 1/1 – Full width (100%). It can be reduced by selecting another width from the following list:
- ¼ – Quarter width (25%)
- ⅓ – Third of a width (33%)
- ½ – Half width (50%)
- ⅔ – Third of a width (67%)
- ¾ – Three quarters of a width (75%)
You can add a title to the graph and a comment by filling in the two optional forms.
Then the shape of the diagram can be selected from the following three shapes:
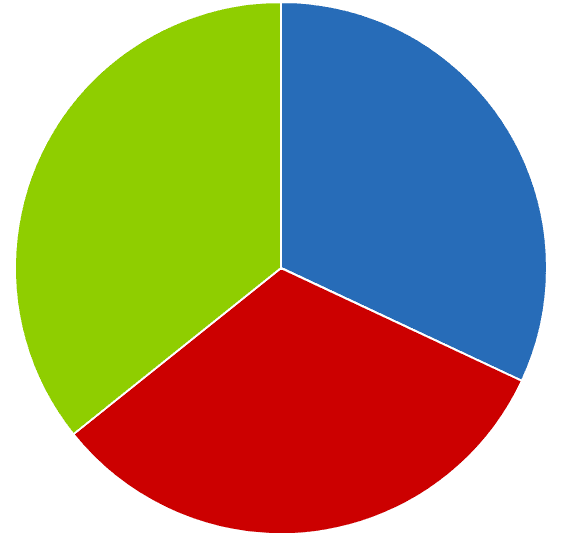
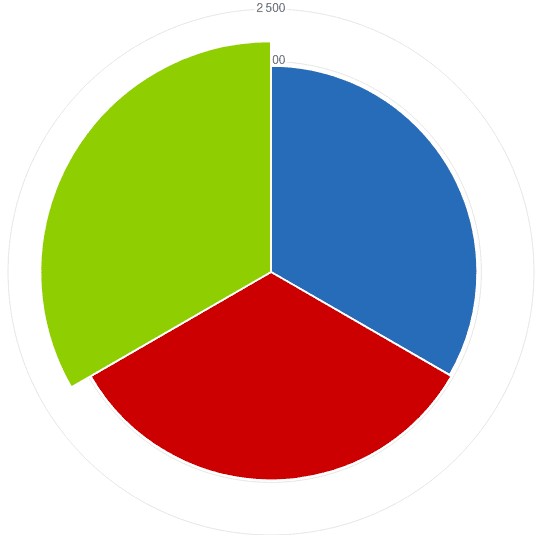
- pie chart
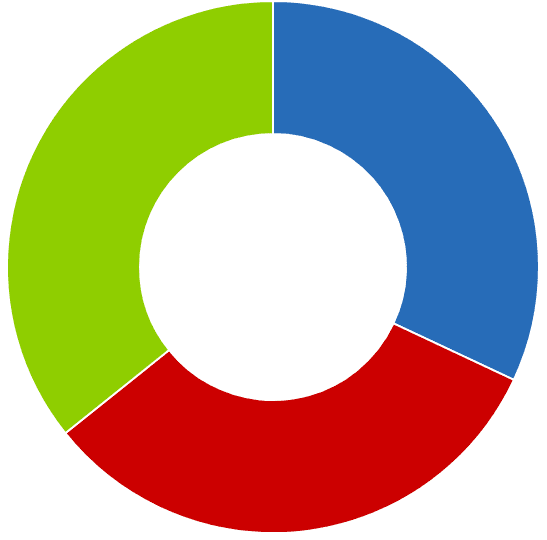
- ring chart
- polar graph
L
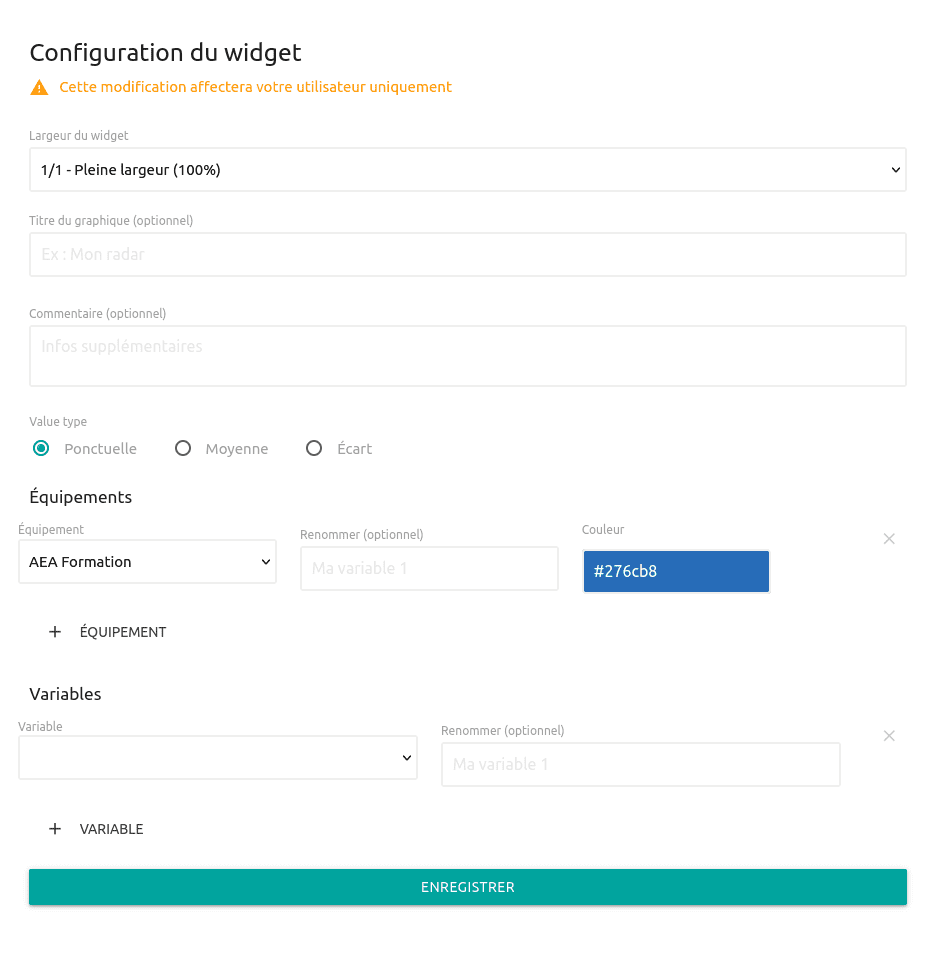
The “Value Type” (“Type de valeur”) field allows you to choose which type of value you want your diagram to represent from three options:
- if you want point values (instantaneous), click on “Point” (“Ponctuelle”).
- If you want averaged values, click on “Average” (“Moyenne”). New time information is then requested. This gives you the choice of calculating averages over:
– a static period. A time interval with a start and end date is then to be filled in
– a calendar period Depending on the chosen period, if you click on previous, then the interval will extend from the previous hour, day, week, month or year to the current date. Depending on the period chosen, if you click on current, then the average will be calculated over the current hour, day, week, month or year. By default the period is the current day.
– a sliding period. Depending on the length of time N entered and the period, the time interval will extend over the last N hour(s), day(s), week(s), month(s) or year(s)
- If you want a difference between two values, click on “Difference”. New timing information is then requested. This gives you the choice of calculating the difference between two values on:
– a static period. The difference will be calculated between the end date and the start date entered.
– a calendar period. Depending on the chosen period, if you click on current/previous, then the difference will be calculated between the current/previous hour, day, week, month or year and the current date. By default the date will be the current day. – a rolling period. The difference will then be calculated between the current date and the N last hour, N last day, N last week, N last month or N last year
By default, point values will be shown on the diagram.
For the diagram to be constructed, it needs values. For this, the “Variables” section must be completed.
For each variable, select the equipment to which it belongs and its name from the drop-down menus.
If the name of the variable is not suitable, it can be renamed by filling in the “Rename” (“Renommer”)field.
The variable will also have a colour on the diagram. This colour is by default blue (#276cb8) but can be changed by clicking on the “Colour” (“Couleur”) field. A colour selector is displayed.
Information
Note that the colour in hexadecimal can be written in the colour boxes.
To add a variable to the chart, click + Variable. A new box appears. It is to be completed in the same way as explained above.

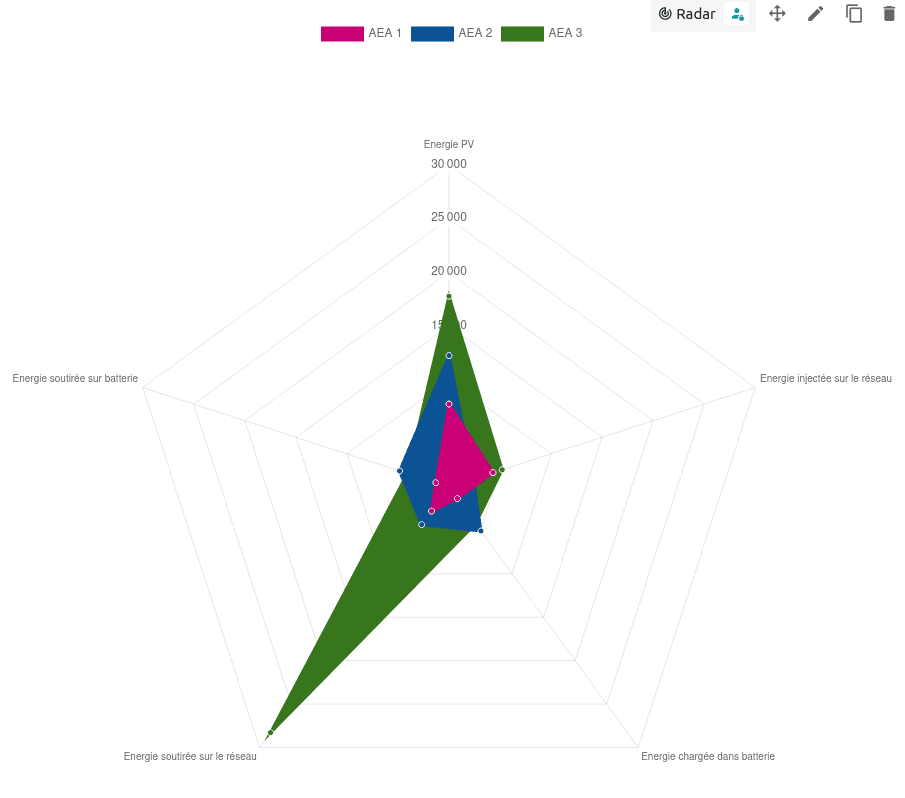
2.5.5 Radar widget
The “Value Type” (“Type de valeur”) field allows you to choose which type of value you want your diagram to represent from three options:
- if you want point values (instantaneous), click on “Point” (“Ponctuelle”).
- If you want averaged values, click on “Average” (“Moyenne”). New time information is then requested. This gives you the choice of calculating averages over:
– a static period. A time interval with a start and end date is then to be filled in
– a calendar period Depending on the chosen period, if you click on previous, then the interval will extend from the previous hour, day, week, month or year to the current date. Depending on the period chosen, if you click on current, then the average will be calculated over the current hour, day, week, month or year. By default the period is the current day.
– a sliding period. Depending on the length of time N entered and the period, the time interval will extend over the last N hour(s), day(s), week(s), month(s) or year(s)
- If you want a difference between two values, click on “Difference”. New timing information is then requested. This gives you the choice of calculating the difference between two values on:
– a static period. The difference will be calculated between the end date and the start date entered.
– a calendar period. Depending on the chosen period, if you click on current/previous, then the difference will be calculated between the current/previous hour, day, week, month or year and the current date. By default the date will be the current day. – a rolling period. The difference will then be calculated between the current date and the N last hour, N last day, N last week, N last month or N last year
By default, point values will be shown on the diagram.
For the diagram to be constructed, it needs values. For this, the “Variables” section must be completed.
For each variable, select the equipment to which it belongs and its name from the drop-down menus.
If the name of the variable is not suitable, it can be renamed by filling in the “Rename” (“Renommer”)field. However, this is optional. To add an axis, click on + Variable.
Information
The radar diagram is used to represent at least three sets of data on a two-dimensional plane. It is therefore recommended to select three pieces of equipment.
2.6 Dedicated widgets

2.6.1 Calendar widget
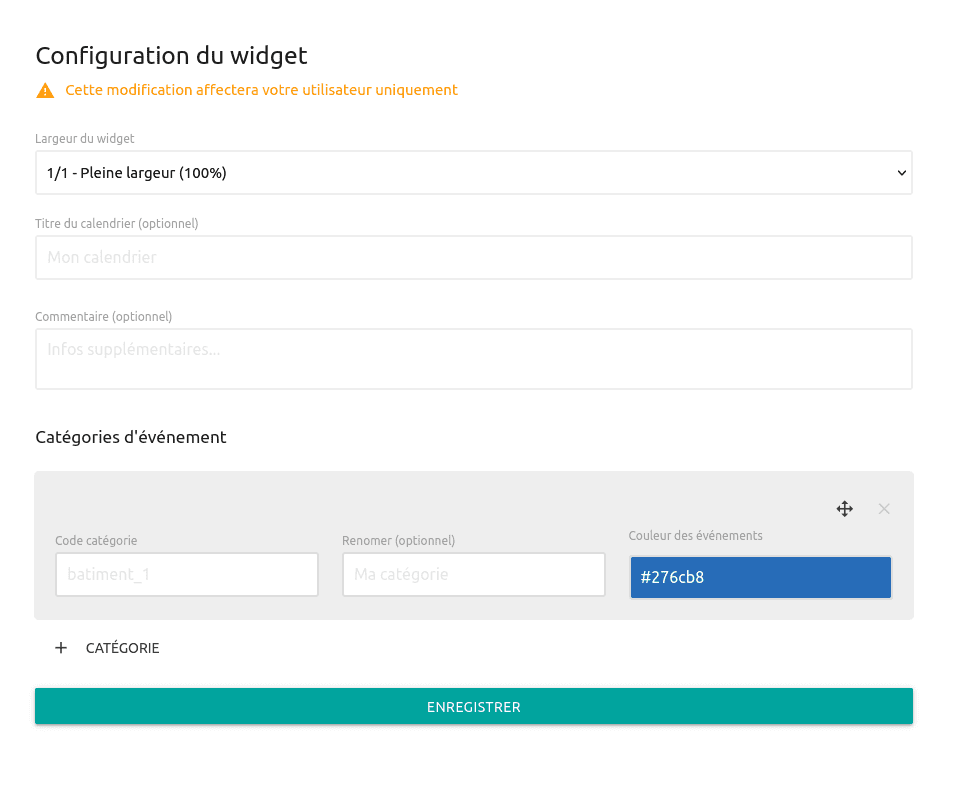
This widget is used to display a calendar for a day, a week or a month. With the help of the calendar, we can declare events.
The default width of the widget is 1/1 – Full width (100%). It can be reduced by selecting another width from the following list:
- ¼ – Quarter width (25%)
- ⅓ – Third of a width (33%)
- ½ – Half width (50%)
- ⅔ – Third of a width (67%)
- ¾ – Three quarters of a width (75%)
You can add a Title to the calendar and a Comment by filling in the two optional forms.
An event belongs to a category. To create a category on the calendar, you just have to fill in the code of the desired category in “Category_code” (“Code_catégorie”) in the “Event categories” (“Catégories d’évènements”) section. Each category will be in a grey frame. You can rename this code by another name in the “Rename(optional)” (“Renommer(optionnel)”) box. All events belonging to this category will be represented by a colour. This colour can be changed by clicking on the “Event colour” (“Couleur des événements”) field. By default it is blue (#276cb8). If you want to add a new category, click on + CATEGORY (“+ CATEGORIE”). A new grey frame appears. It is to be filled in like the previous one.
Navigating the widget
In visualization mode, several features are available.
Programming an event
To schedule a new event, click on the “Schedule” (“Programmer”) button at the top right corner. The following popup window will open:
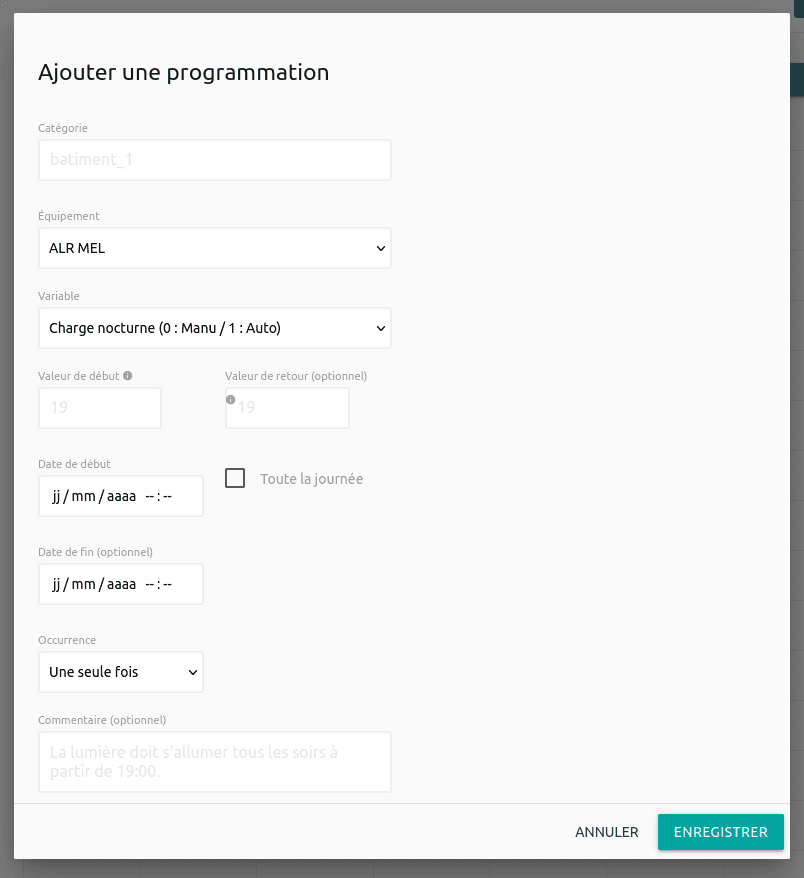
The event we are going to create can belong to a category. Fill in the “Category” (“Catégorie”) field with the name of the category you want or select the category from those proposed. All the events in the same category will then have the same colour. It is important to note that if you do not fill in this box, the event will not be classified in any category but will still be coloured. All events that do not have a category will have the same colour.
An event is raised on a variable. Choose the equipment in the “Equipment” (“Équipements”) drop-down menu and the name of the desired variable in the “Variable” drop-down menu.
When an event occurs, the variable will have a new value. For example, 1 to signify that the lighting is switched on. This value will be written to the Start Value field. Note that if the value is a string then it should be enclosed in quotes (“….”).
When the event is over, you can choose to assign a new value to the variable. This value will be entered in the “Return Value” (“Valeur de retour”) field. It is optional and if we leave this box empty then the value of the variable will be the same as before the event.
An event will be lifted during a defined period of time with a start date and an end date. The start date must be entered in the “Start date” (“Date de début”) field in the format dd/mm/yyyy hh:mm (day/month/year hour:minute). By clicking on this field, you have the possibility to choose a date thanks to a date selector. By checking the box “All day” (“Toute la journée”), the event will be lifted the whole day of the entered start date. For the event to end, enter an end date in the “End Date” field in the format dd/mm/yyyy hh:mm (day/month/year hour:minute). By clicking on this field, you have the possibility to choose a date thanks to a date selector. The filling in of this field is optional. If no end date is specified then the event will be lifted from the start date to an unspecified duration.
By default, the event will appear only once. But if you want to make this event recurrent, in the field “Occurrence” select a new occurrence among:
- every day
- each week
- each month
- each year
Finally, the event can be stamped with a comment written in the “Comment” (“Commentaire”) field.
Finally, to create the event schedule click on the “Save” (“Enregistrer”) button
Changing the schedule of an event
Another feature of the calendar is event editing. To change the schedule of an event, click on the desired event on the calendar. A popup window called “Edit Schedule” (“Modifier une programmation”) opens. The same fields as for creating an event are displayed. To modify the event, simply change the desired fields (refer to the section “Scheduling an event” (“Programmation d’un événement”) for the information on these fields).
In this window, it is possible to delete the event, by checking “Delete schedule” (“Supprimer la programmation”). This action is irreversible. Once ticked, you can indicate which schedule you wish to delete:
- only the event selected
- this event and the following ones, i.e. if the event is a recurrent event then the following ones as well as this one will be deleted
- all past and future events and this one will be deleted
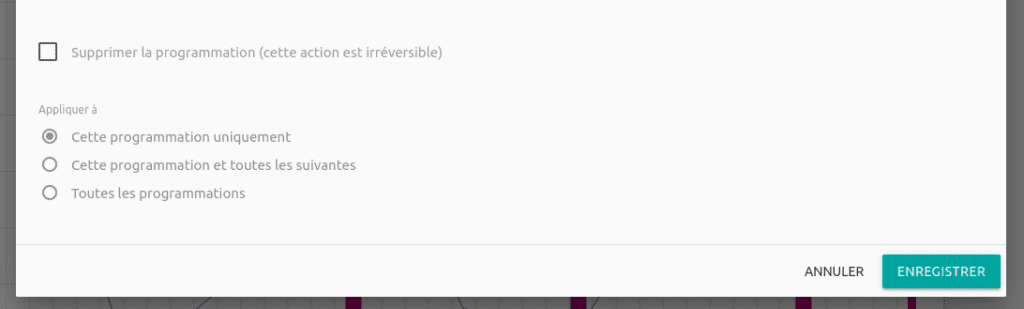
Click the “Save” (“Enregistrer”) button again to save the changes.
Information
If the modified event is a recurring event then the modification will be affected on all other events.
Event filtering
Another feature of the calendar is the filtering of events. In the top right-hand corner, you can make a category of events appear/disappear by clicking on the category name. As many categories as you like can be shown or hidden.
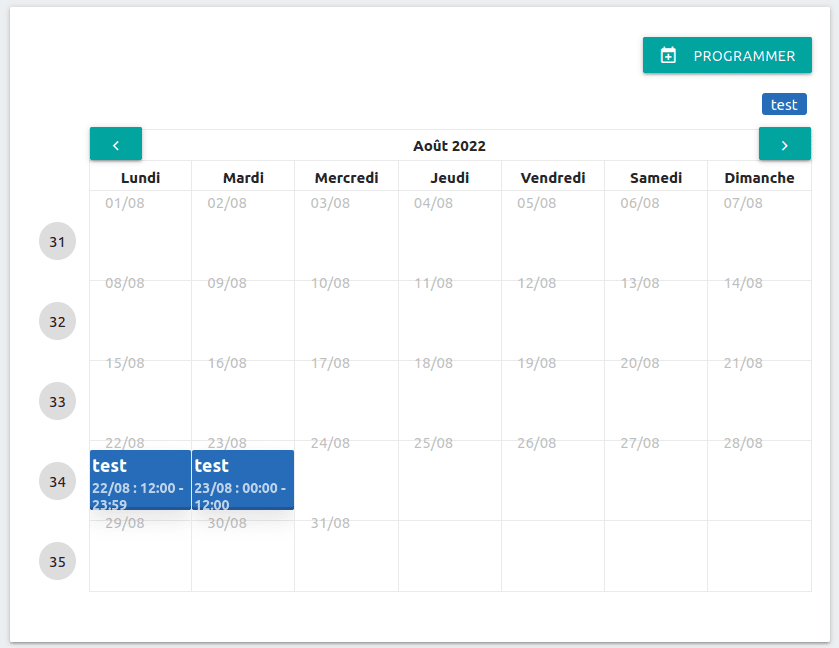
Day, week or month view
Three types of event view are possible.
The default view is the week view.
To view the events of a day in more detail, click on the desired date (e.g. Tue 30/08).
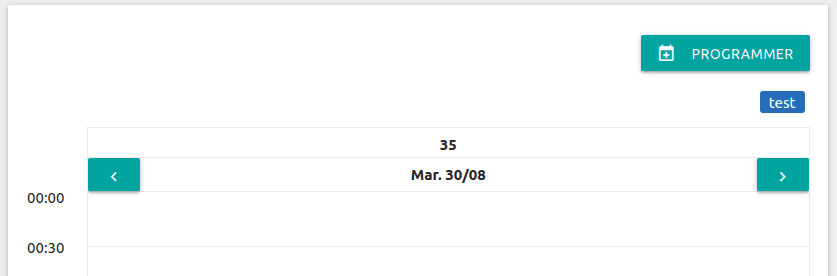
To switch back to a week view from a day view, click on the week number above the date (e.g. here 35).
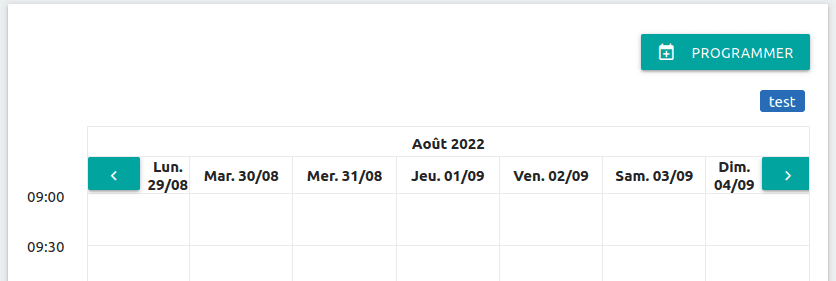
To view the events for a whole month, first have a week view, then click on the month above the dates (e.g. in our screenshot August 2022).
o return to a week view, simply click on the number of the week you want on the left (in the screenshot above, the available week numbers are 31, 32, 33, 34 and 35).
You can move from day to day, week to week or month to month by clicking on the green arrows at the top left and right.

2.6.2 Alarms widget
his widget is used to display the list of alarms that have been raised. These alarms can always be raised or turned off. They can also be acknowledged.
“Appearance” Tab (“apparence”)
This tab allows you to configure the general appearance of the widget and its header.
The default width of the widget is 1/1 – Full width (100%). It can be reduced by selecting another width from the following list:
- ¼ – Quarter width (25%)
- ⅓ – Third of a width (33%)
- ½ – Half width (50%)
- ⅔ – Third of a width (67%)
- ¾ – Three quarters of a width (75%)
You can add a name to the widget and a comment by filling in the two optional forms.
Checking “Enable filter from widget” (“Activer le filtre depuis le widget”) unlocks the alarm filtering features on the widget from the view mode.
“Data” tab (“Données”)
The list of alarms will be presented in the form of a scalable table. A table has several columns. A column is represented in a grey box as shown in the following example:
The name of the column is written in the “Content” (“Contenu”) field. Another column can be selected from its drop-down menu.
Warning
If a new column is selected then it may already be selected further down. It is therefore very important to view all the columns so that you do not end up with the same column twice or more.
The default table will consist of four columns whose names in order are:
- Date
- Equipment
- Variable
- Alarm
A fifth column (Category of the variable) is available in the drop-down menu of the “Content” (“Contenu”) field.
By filling in the “Rename” (“Renommer”) field, you rename the name of the column. This action is optional and by default the name of the column will be the one entered in the “Content” (“Contenu”) field.
It is also possible to choose the size of the column width. By default the size of the column will be adjusted automatically but it can be changed by clicking on “Column Width” (“Largeur de la Colonne”). It can be set like this:
- small (10%)
- average (25%)
- large (50%)
By checking, “Truncate value if too long” then the table will display truncated variables whose number of significant digits will depend on the size of the widget.
To delete the column, click on the red cross at the top right.

To change the order of the columns, click on the four-arrow icon at the top right and then drag the column to the desired location.
To add a column, click on the button + COLUMN (+COLONNE) at the bottom A new grey insert to be completed appears.
“Sort” & “filter” tab (“Tri”, “filtre”)
Default sorting
To view the table, it is necessary to select a column (from the Column drop-down menu) whose elements will be sorted either in ascending or descending order (from the Order drop-down menu).
You can choose to sort by five columns:
- Alarm
- Categories of the variable
- Date
- Equipment
- Variable
Default filter
If you wish to view specific items, you can filter by selecting the filter attribute(s) of a column. It is possible to filter on several columns.
An attribute can be deleted by clicking on the cross to the left of it (on the attribute itself) (e.g. to delete the AEA Training attribute, click on the cross to the left).
The filter on a particular column can be set to no. To exclude a filter on a column, click on the following button:

The column box is then circled in red:
To clear a filter of all its attributes, click on the broom icon to the right of the filtered box:
For the calendar content type, we can filter on the column(s) that make up our table. These columns are the same as those declared previously in the “Data” (“Données”) tab.
In addition to filtering on columns, alarms can be filtered on a specific period in the “Date” section.
Four choices of period are available to us:
- “No period defined” (“Aucune période définie”): all alarms will be displayed.
- “Static period” (Période statique”): the start and end date of the period must be chosen. By clicking on the Start date or End date box, you can enter the date by writing it down or by selecting it with the date selector displayed.
- “Calendar Period” (“Période calendaire”): defines a time interval for displaying alarms from the current or previous date. You can choose to display alarms for the previous or current hour, day, week, month or year by selecting the desired period and offset from the drop-down menu. By default the period is the current day.
- “Rolling period” (“Période glissante”): defines a time interval from the last hour(s)/day(s)/week(s)/month to the current date. To do this, simply enter a duration and a period type in the drop-down menu. By default, the period is from yesterday to today.
Navigating the widget
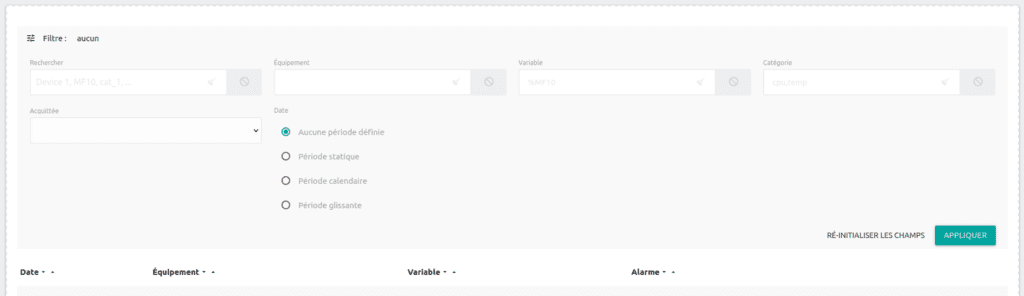
Filtering in visualization mode
Une fois le widget créé, si on a coché “Activer le filtre depuis le widget” alors on peut directement sur le widget filtrer les alarmes en cliquant sur “Filtre” depuis le mode visualisation. On peut filtrer les alarmes sur les colonnes Équipement, Variable et Catégorie.
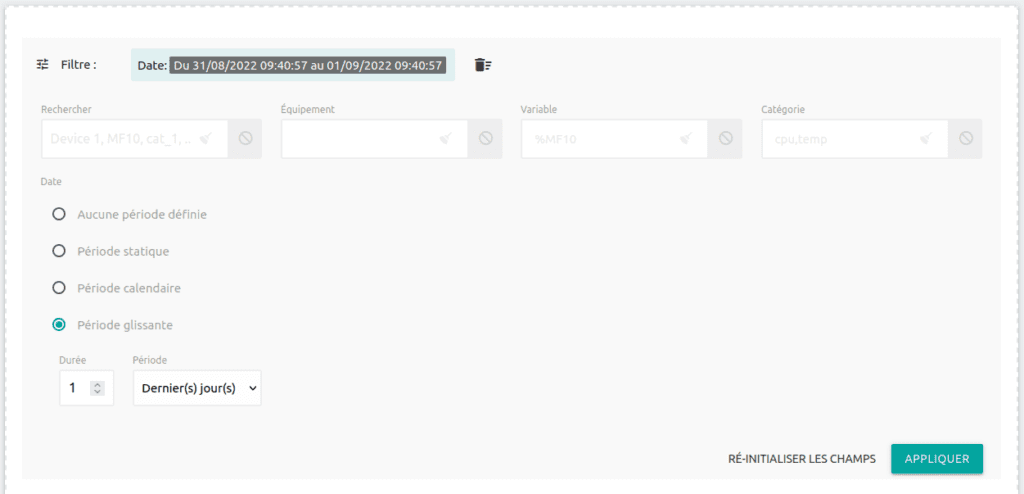
If you are looking for a specific alarm(s) then you can enter a keyword in the “Search” (“Rechercher”) field so that only alarms with this keyword are displayed.
The period can also be changed in the “Date” section. The same fields as before are available.
Once the filtering is complete, click on “Apply” (“Appliquer”).
If you want to reset the fields (so that they are all blank again), click on the “Reset fields” (“Ré-initialisé les champs”) button.
Acknowledge an alarm
Acknowledging an alarm means that you have noticed that there is an alarm. In no case will the alarm go off as a result of an acknowledgement. The problem raised by the alarm must be solved for it to go off. The acknowledgement is a reminder.

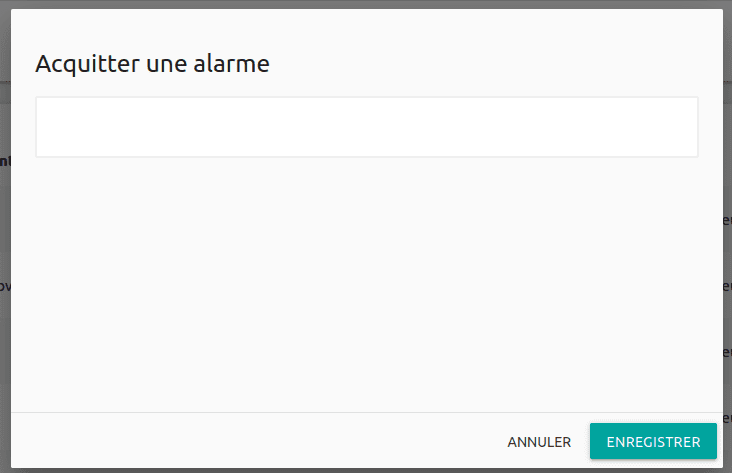
Thus, when an alarm is raised, it can be acknowledged by clicking on the icon:
An Acknowledge message appears, click on it. A popup windowopens. You can write a message in this window (for example, “Problem to be solved within 2 days”). Then click on “Save” (“Enregistrer”). If you have made a mistake and do not want to acknowledge the alarm, click on “Cancel” (“Annuler”).
columns SORTING

You can change the sorting of the columns by clicking on the up and down arrows next to the column you want to sort on. For example, in the screenshot, you can see the up and down arrows to the right of the column named “Date”.

2.6.3 Events widget
This widget is used to display the list of events that have occurred over a certain period of time.
“Appearance” TAB (“apparence”)
This tab allows you to configure the general appearance of the widget and its header.
The default width of the widget is 1/1 – Full width (100%). It can be reduced by selecting another width from the following list:
- ¼ – Quarter width (25%)
- ⅓ – Third of a width (33%)
- ½ – Half width (50%)
- ⅔ – Third of a width (67%)
- ¾ – Three quarters of a width (75%)
You can add a name to the widget and a comment by filling in the two optional forms.
Checking “Enable filter from widget” (“Activer le filtre depuis le widget”) unlocks the event filtering features on the widget from the view mode.
“Data” tab (“Données”)
The list of events will be presented in the form of a scalable table. A table has several columns. A column is represented in a grey box as shown in the example:
The name of the column is in the “Content” (“Contenu”) field. Another column can be selected from its drop-down menu.
Warning
Be careful, if you choose a new column then it may already be selected below. It is therefore very important to view all the columns so as not to end up with the same column twice or more.
The default table will consist of 5 columns whose names in order are:
- Date
- Equipment
- Variable
- Wording
- Action
A sixth column (Category of the variable) is available in the drop-down menu of the “Content” (Contenu”) field.
By filling in the “Rename” (“Renommer”) box, you rename the name of the column. This action is optional and by default the name of the column will be the one entered in the “Content” field.
It is also possible to choose the size of the column width. By default the size of the column will be adjusted automatically but it can be changed by clicking on “Column Width” (“Largeur de la Colonne”). It can be set like this:
- small (10%)
- average (25%)
- large (50%)
By checking, “Truncate value if too long” (“Tronquer la valeur si trop longue”) then the table will display truncated variables whose number of significant digits will depend on the size of the widget.
To delete the column, click on the red cross at the top right.
To change the order of the columns, click on the four-arrow icon at the top right and then drag the column to the desired location.
To add a column, click on the button + COLUMN (“+ COLONNE”). A new grey insert to be completed appears.
“filter” tab (“Filtre”)
default filter
f you wish to view specific items, you can filter by selecting the filter attribute(s) of a column. It is possible to filter on several columns.
An attribute can be deleted by clicking on the cross to the left of it (on the attribute itself) (e.g. to delete the AEA Training attribute, click on the cross to the left of it).
The filter on a particular column can be set to no. To exclude a filter on a column, click on the following button:
The column box is then circled in red:
To clear a filter of all its attributes, click on the broom icon to the right in the filtered field.
For the calendar content type, you can filter on the columns:
- Equipment
- Variable
- Category.
In addition to filtering on the columns, you can filter the events on a precise period in the “Date” part.
Four choices of period are available to us:
- “No period defined” (“Aucune période définie”): all alarms will be displayed.
- “Static period” (“Période statique”): the start and end date of the period must be chosen. By clicking on the “Start date” (“Date de début”) or “End date” (“Date de fin”) field, you can enter the date in dd-mm-yyyy hh:mm format (day/month/year hour:minute) or select it using the date selector that appears.
- “Calendar period” (“Période calendaire”): defines a time interval for displaying events from the current or previous date. You can choose to display the events of the previous or current hour, day, week, month or year by selecting the desired period and the offset in the drop-down menu. By default the period is the current day.
- “Rolling period” (“Période glissante”): defines a time interval from the last hour(s)/day(s)/week(s)/month to the current date. To do this, simply enter a duration and a period type in the drop-down menu. By default, the period is from yesterday to today.
Information
Note that the events are sorted in chronological order.
Navigating the widget
Once the widget has been created, if you have checked “Enable filter from widget” (“Activer le filtre depuis le widget”) then you can filter the events directly on the widget by clicking on “Filter” (“Filtre”). You can filter on the Equipment, Variable and/or Category columns.
If you are looking for a specific event(s) then you can enter a keyword in the “Search” (“Rechercher”) field so that only events with that keyword are displayed.
The period can also be changed in the “Date” section. The same fields as before are available.
Once the filtering is complete, click on “Apply” (“Appliquer”).
If you want to reset the fields (so that they are all blank again), click on “Reset fields” (“Ré-initialisé les champs”).

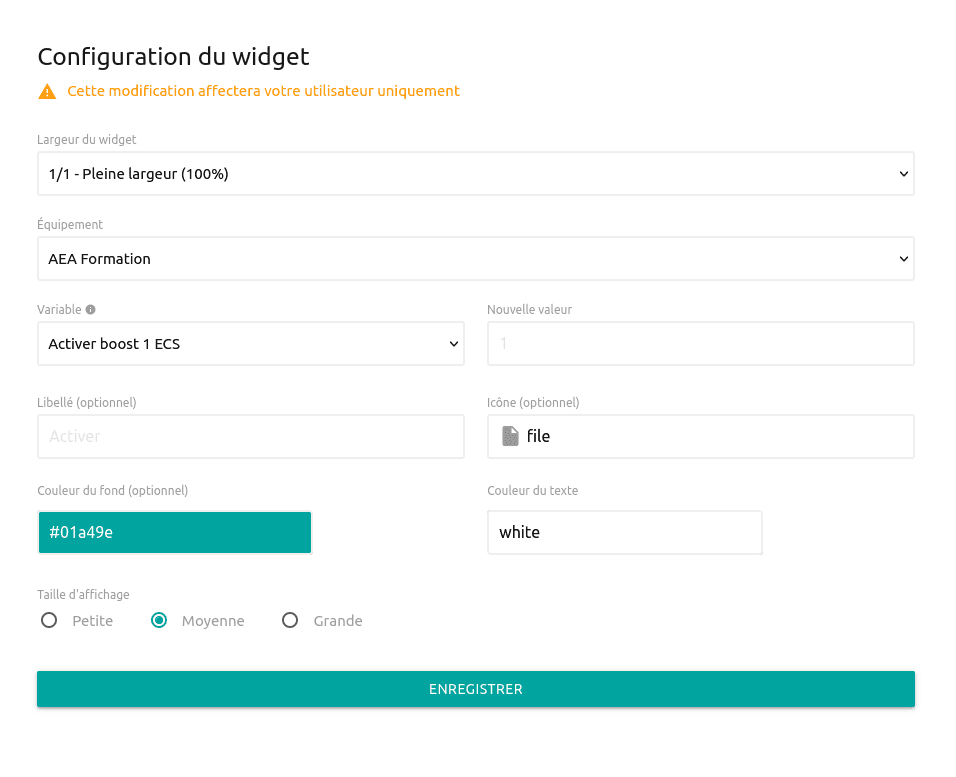
2.6.4 Button widget
This widget allows you to create a button which, while it is active, will modify the value of a variable.
The default width of the widget is 1/1 – Full width (100%). It can be reduced by selecting another width from the following list:
- ¼ – Quarter width (25%)
- ⅓ – Third of a width (33%)
- ½ – Half width (50%)
- ⅔ – Third of a width (67%)
- ¾ – Three quarters of a width (75%)
A button is linked to a variable. Choose the equipment in the “Equipment” (“Équipements”) drop-down menu and the name of the desired variable in the “Variable” drop-down menu.
When the button is activated, the variable will take a new value. This new value is to be written in the field of the same name. Only variables that are allowed to be forced are selectable.
It is possible to add a name to the button. This new name must be written in the “Label” (“Libellé”) field, but this step is optional. This new name will be placed on the right side of the button.

To its left, the button is marked with an icon. By default, the icon displayed will be that of a file. This icon can be changed by selecting another icon by clicking on the “Icon” (“Icône”) field. This is optional.
It can be easily changed by clicking on the “Background colour” (“Couleur du fond”) field. A colour selector appears. This is optional.
You can also change the colour of the text by clicking on the “Text colour” (“Couleur du texte”) field. A colour picker will appear allowing us to choose from a large number of colours.
Information
Note that the colour in hexadecimal can be written in the colour boxes.
The size of the button display is adjustable:
- the button will be small if you check “Small” (“Petite”).
- the button will be of normal size if you check “Medium”(“Moyenne”).
- the button will be large if you check “Large” (“Grande”).
By default the size is set to medium.
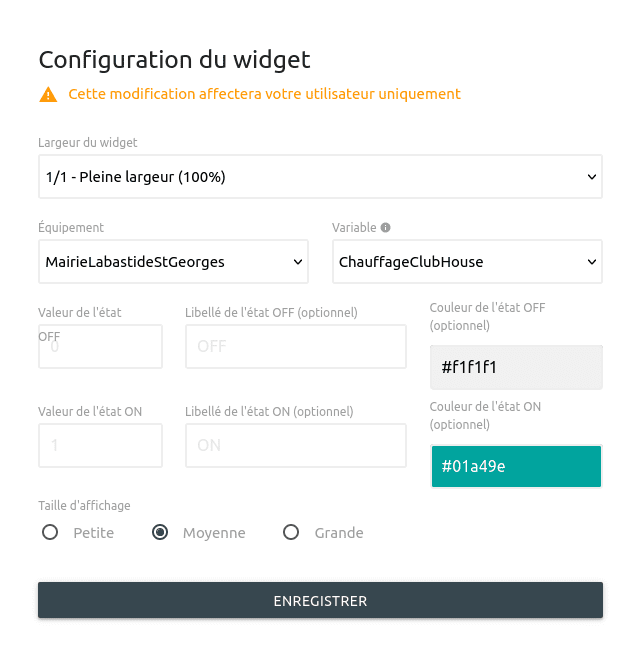
2.6.5 Switch Widget
This widget allows you to create a switch that when turned on (ON state) changes the value of a variable. When the switch is off, the variable will have the value of its OFF state.
The default width of the widget is 1/1 – Full width (100%). It can be reduced by selecting another width from the following list:
- ¼ – Quarter width (25%)
- ⅓ – Third of a width (33%)
- ½ – Half width (50%)
- ⅔ – Third of a width (67%)
- ¾ – Three quarters of a width (75%)
A switch is linked to a variable. Choose the equipment in the “Equipment” (“Équipements”) drop-down menu and the name of the desired variable in the “Variable” drop-down menu.
When the switch is turned off (OFF state), the variable will take a default value. This new value is to be written in the field “Value of the OFF state” (“Valeur de l’état OFF”). Only the variables authorised to be forced are selectable. It is possible to give a title to this state. This title is to be written in the “OFF state label” (“Libellé de l’état OFF”) field, but this step is optional. In addition, to be more visible, it is possible to colour the button when it is in this state by choosing a colour in the colour selector of the “Colour of the OFF state” (“Couleur de l’état OFF”) field. The default background colour of the button is grey (#f1f1f1). This is also optional.
When the switch is turned on (ON state), the variable will take a default value. This new value is to be entered in the field “Value of the ON state”. Only the variables authorized to be forced are selectable. It is possible to give a title to this state. This title must be entered in the “ON state label” (“Libellé de l’état ON”) field, but this step is optional. In addition, to be more visible, it is possible to colour the button when it is in this state by choosing a colour in the colour selector in the “ON state colour” (“Couleur de l’état ON”) field. The default background colour of the button is blue (#01a49e). This is also optional.
Information
Note that the colour in hexadecimal can be written in the colour boxes.
The size of the button display is adjustable:
- the button will be small if you check “Small” (“Petite”).
- the button will be of normal size if you check “Medium” (“Moyenne”).
- the button will be large if you check “Large” (“Grande”).
By default the size is set to medium.
3. Presentation of the API
3.1 General
This document details the HTTP requests that allow the user to interact with MicroSERVER through functions, thus providing a communication interface between the web server and other external services.
Information
The documentation only informs about the tables "devices" and "variables" and about reading the historical data. However, the same reasoning applies to the other tables in the database.
3.2 Functions
3.2.1 Headers
First of all, each request will have a ‘headers’ parameter. In order to properly authenticate to the API, we need an API key (api_key). This key will then be used in the request by calling it in this way:
headers={'Authorization': 'Bearer {api_key}'.format(api_key=API_KEY)} 3.2.2 GET method
Thanks to the MicroSERVER API, it is possible to obtain information on the tables:
- variables (variables)
- equipment (devices)
It is also possible to obtain information on historical data:
- events
- alarms
- historical values (plot-values)
- historical counters (diff-values)
- raw historical data (log-entries)
Information
The data is returned in JSON format. The examples were made in Python but other languages can be used to send requests to the API.
3.2.2.1 Variables
To get the list of variables, the HTTP request will be:
/variablesThis query can be given several additional parameters in order to get more precise information. Parameters that will only take one value are identified by param=VALUE and parameters that can take a list of values are identified by param[]=VALUES:
| Parameters | Description |
| limit=VALUE | Maximum number of items (VALUE) to be returned |
| sort=VALUE(,asc/desc) or sort[]=VALUES(,asc/desc) | Sorting on VALUE in an ascending (,asc) or descending (,desc) manner. It is possible to sort on several VALUE fields |
| field=VALUE ourfield[]=VALUES | Filtering on the desired VALUE field or fields |
| search=VALUE | Returns only items where any field contains the text VALUE |
| search~x=VALUE | Returns only items where any field does not contain the text VALUE |
| cursor=VALUE | Value of the ‘cursor’ field returned in the last query with the limit=VALUE parameter set to obtain the sequence of items |
| champ=VALUE | Returns only those items whose specified fields have a value equal to the specified VALUE. |
| champ~x=VALUE | Returns only those items whose specified fields do not have a value equal to the specified VALUE. |
| champ~s=VALUE | Returns only those items whose specified fields have a value containing the specified VALUE. |
| champ~sx=VALUE | Returns only those items whose specified fields do not have a value containing the specified VALUE. |
| champ~i=VALUE | Returns only those items whose specified fields contain a value within the specified range as ‘[‘ or ‘]’ followed by {min-value}, then ‘;’, then {max-value}, then ‘]’ or ‘[‘. |
| champ~ix=VALUE | Returns only those items whose specified fields contain a value within the specified range as ‘[‘ or ‘]’ followed by {min-value}, then ‘;’, then {max-value}, then ‘]’ or ‘[‘. |
For variables, the list of possible fields is:
| Nom du Name of the field | Description |
| id | Identifier of the variable |
| deviceId | Equipment identifier |
| device | Name of the equipment |
| displayLabel | Value of the representation of the variable |
| addres | Address of the variable |
| type | Type of variable |
| intRegister | Address of the variable |
| priority | Priority of the variable |
| mnemonic | Mnemonic of the variable |
| label | Name of the variable |
| comment | Comment |
| isInternal | Boolean indicating whether the variable is internal or not |
| isPublic | Boolean indicating whether the variable is public or not |
| isWriteable | Boolean indicating whether the variable can be written or not |
| minWriteValue | Minimum value that the variable can take |
| maxWriteValue | Maximum value that the variable can take |
| categories | Categories to which the variable belongs |
| format | Format of the variable |
| floatPrecision | Integer indicating the number of significant digits after the decimal point. 0 if the variable is not a decimal. |
| unit | Unit of the variable. If no unit then ” is returned. |
| minRemoteScaleValue | Minimum gross value |
| maxRemoteScaleValue | Maximum gross value |
| minLocalScaleValue | Minimum value when scaling |
| maxLocalScaleValue | Maximum value when scaling |
| inhibitionUser | User who has disabled the alarm |
| inhibitionStartTime | Start date of inhibition |
| inhibitionStopTime | End date of inhibition |
| hasAlarm | Boolean to enable alarm management |
| alarmLabel | Alarm wording |
| alarmCondition | Alarm condition |
| hasEvent | Boolean allowing event management |
| eventLabel | Name of the event |
| eventCondition | Condition of the event |
| hasPlot | Boolean to allow historical values |
| plotIsAveraged | Boolean allowing to average the curve |
| plotMinDelay | Time between two points in seconds on the curve |
| plotMinDiff | Hysteresis of the variable |
| snmpOID | SNMP address of the variable |
| snmpType | SNMP type of the variable |
| rawValue | Current value of the variable |
| displayValue | Formatted value of the variable |
By default, all values will be returned with all fields sorted in chronological order of variable creation.
An example of an HTTP request is:
https://192.168.1.223/variables?limit=2&field[]=id&field[]=mnemonicThe code written in Python will be as follows:
query = 'variables?'
query += urlencode({'limit': 2, 'field[]': ['id', 'mnemonic']}, doseq=True)
req = requests.get(SERVER_URI + requote_uri(query), headers={
        'Authorization': 'Bearer {api_key}'.format(api_key=API_KEY)
    })
if req.status_code == 200:
    print('OK')
    data = req.json()
    print(data)
else:
    print('ERR:', req.json())
The answer to this query is:
{'items': [{'id': '6', 'mnemonic': 'ALM_COM@1'}, {'id': '7', 'mnemonic': 'BUSY_COM@1'}], 'cursor': '{"field":["id","mnemonic"],"lastValues":["7"]}'}Information
In the response to the query we see that there is a 'cursor' key in addition to the items returned. This key means that there is other data in addition to the one returned in the response and that the last value returned has id 7 ("lastValues":["7"]) and that the response contains the fields 'id' and 'mnemonic' ("field":["id", "mnemonic"]).
3.2.2.2 equipment
To get the list of equipment, the HTTP request will be:
/devicesThis query can be given several additional parameters in order to get more precise information. Parameters that will only take one value are identified by param=VALUE and parameters that can take a list of values are identified by param[]=VALUES:
| Parameters | Description |
| limit=VALUE | Maximum number of items (VALUE) to be returned |
| sort=VALUE(,asc/desc) or sort[]=VALUES(,asc/desc) | Sorting on VALUE in an ascending (,asc) or descending (,desc) manner. It is possible to sort on several VALUE fields |
| field=VALUE or field[]=VALUES | Filtering on the desired VALUE field or fields |
| search=VALUE | Returns only items where any field contains the text VALUE |
| search~x=VALUE | Returns only items where any field does not contain the text VALUE |
| cursor=VALUE | Value of the ‘cursor’ field returned in the last query with the limit=VALUE parameter set to obtain the sequence of items |
| champ=VALUE | Returns only those items whose specified fields have a value equal to the specified VALUE. |
| champ~x=VALUE | Returns only those items whose specified fields do not have a value equal to the specified VALUE. |
| champ~s=VALUE | Returns only those items whose specified fields have a value containing the specified VALUE. |
| champ~sx=VALUE | Returns only those items whose specified fields do not have a value containing the specified VALUE. |
| champ~i=VALUE | Returns only those items whose specified fields contain a value within the specified range as ‘[‘ or ‘]’ followed by {min-value}, then ‘;’, then {max-value}, then ‘]’ or ‘[‘. |
| champ~ix=VALUE | Returns only those items whose specified fields contain a value that is not within the specified range as ‘[‘ or ‘]’ followed by {min-value}, then ‘;’, then {max-value}, then ‘]’ or ‘[‘. |
For equipment, the list of possible fields is:
| Name of the field | Description |
| id | Equipment identifier |
| isActive | Boolean indicating whether the equipment is active (1) or in error (0) |
| type | Type of equipment |
| name | Name of the equipment |
| comment | Comment |
| displayLabel | Value of the equipment representation |
| zones | Area(s) of the equipment |
| purgeDelay | Time to purge history (in days) |
| timeout | Timeout (in seconds) |
| refreshDelay | Refresh time (in seconds) |
| comProtocol | Communication protocol used |
| comPort | Communication port used |
| slaveNumber | Slave number. None for none. |
| password | Equipment password |
| comState | Communication status |
| alarms | Number of active alarms |
| isEditable | Boolean indicating whether the equipment is modifiable by a user |
By default, all values will be returned with all fields sorted in chronological order of equipment creation.
An example of an HTTP request is:
https://192.168.1.223/devices?limit=2&field[]=id&field[]=isActive&field[]=typeThe code written in Python will be as follows:
query = 'devices?'
query += urlencode({'limit': 2, 'field[]': ['id', 'isActive', 'type']}, doseq=True)
req = requests.get(SERVER_URI + requote_uri(query), headers={
        'Authorization': 'Bearer {api_key}'.format(api_key=API_KEY)
    })
if req.status_code == 200:
    print('OK')
    data = req.json()
    print(data)
else:
    print('ERR:', req.json())
The answer to this query is:
{'items': [{'id': '1', 'isActive': True, 'type': 'AEH10000'}, {'id': '2', 'isActive': True, 'type': 'Surveillance poulailler'}], 'cursor': '{"field":["id","isActive","type"],"lastValues":["2"]}'}3.2.2.3 Alarms
To get the list of alarms, the HTTP request will be:
/alarmsThis query can be given several additional parameters in order to get more precise information. Parameters that will only take one value are identified by param=VALUE and parameters that can take a list of values are identified by param[]=VALUES:
| Parameters | Description |
| limit=VALUE | Maximum number of items (VALUE) to be returned |
| sort=VALUE(,asc/desc) or sort[]=VALUES(,asc/desc) | Sorting on VALUE in an ascending (,asc) or descending (,desc) manner. It is possible to sort on several VALUE fields |
| field=VALUE or field[]=VALUES | Filtering on the desired VALUE field or fields |
| search=VALUE | Returns only items where any field contains the text VALUE |
| search~x=VALUE | Returns only items where any field does not contain the text VALUE |
| cursor=VALUE | Value of the ‘cursor’ field returned in the last query with the limit=VALUE parameter set to obtain the sequence of items |
| champ=VALUE | Returns only those items whose specified fields have a value equal to the specified VALUE. |
| champ~x=VALUE | Returns only those items whose specified fields do not have a value equal to the specified VALUE. |
| champ~s=VALUE | Returns only those items whose specified fields have a value containing the specified VALUE. |
| champ~sx=VALUE | Returns only those items whose specified fields do not have a value containing the specified VALUE. |
| champ~i=VALUE | Returns only those items whose specified fields contain a value within the specified range as ‘[‘ or ‘]’ followed by {min-value}, then ‘;’, then {max-value}, then ‘]’ or ‘[‘. |
| champ~ix=VALUE | Returns only those items whose specified fields contain a value that is not within the specified range as ‘[‘ or ‘]’ followed by {min-value}, then ‘;’, then {max-value}, then ‘]’ or ‘[‘. |
| Nom du champs | Description |
| id | Alarm identifier |
| time | Timestamp at which the alarm was raised |
| variableId | Identifier of the variable |
| variable | Name of the variable |
| variableCategories | Categories of the variable |
| deviceId | Equipment identifier |
| device | Name of the equipment |
| label | Alarm label |
| isAck | Boolean indicating whether the alarm has been acknowledged or not |
| ackTime | Timestamp at which the alarm was acknowledged |
| ackUser | Name of the user who acknowledged the alarm |
| ackComment | Comment left when the alarm is acknowledged |
By default, all values will be returned with all fields sorted in chronological order of alarm occurrence.
An example of an HTTP request is:
https://192.168.1.223/alarms?limit=2&sort=time,desc&field[]=id&field[]=timeThe code written in Python will be as follows:
query = 'alarms?'
query += urlencode({'sort': 'time,desc', 'limit': 2, 'isActive': True, 'field[]': ['id', 'time']}, doseq=True)
req = requests.get(SERVER_URI + requote_uri(query), headers={
        'Authorization': 'Bearer {api_key}'.format(api_key=API_KEY)
    })
if req.status_code == 200:
    print('OK')
    data = req.json()
    print(data)
else:
    print('ERR:', req.json())
The answer to this query is:
{'items': [{'id': '270953256', 'time': 1660202056.43676}, {'id': '270953231', 'time': 1660202054.86892}], 'cursor': '{"sort":"time,desc","isActive":"True","field":["id","time"],"lastValues":[1660202054.86892,"270953231"]}'}3.2.2.4 events
To get the list of events, the HTTP request will be:
/eventsThis query can be given several additional parameters in order to get more precise information. Parameters that will only take one value are identified by param=VALUE and parameters that can take a list of values are identified by param[]=VALUES:
| Parameters | Description |
| limit=VALUE | Maximum number of items (VALUE) to be returned |
| sort=VALUE(,asc/desc) or sort[]=VALUES(,asc/desc) | Sorting on VALUE in an ascending (,asc) or descending (,desc) manner. It is possible to sort on several VALUE fields |
| field=VALUE or field[]=VALUES | Filtering on the desired VALUE field or fields |
| search=VALUE | Returns only items where any field contains the text VALUE |
| search~x=VALUE | Returns only items where any field does not contain the text VALUE |
| cursor=VALUE | Value of the ‘cursor’ field returned in the last query with the limit=VALUE parameter set to obtain the sequence of items |
| champ=VALUE | Returns only those items whose specified fields have a value equal to the specified VALUE. |
| champ~x=VALUE | Returns only those items whose specified fields do not have a value equal to the specified VALUE. |
| champ~s=VALUE | Returns only those items whose specified fields have a value containing the specified VALUE. |
| champ~sx=VALUE | Returns only those items whose specified fields do not have a value containing the specified VALUE. |
| champ~i=VALUE | Returns only those items whose specified fields contain a value within the specified range as ‘[‘ or ‘]’ followed by {min-value}, then ‘;’, then {max-value}, then ‘]’ or ‘[‘. |
| champ~ix=VALUE | Returns only those items whose specified fields contain a value that is not within the specified range as ‘[‘ or ‘]’ followed by {min-value}, then ‘;’, then {max-value}, then ‘]’ or ‘[‘. |
| Nom du champs | Description |
| time | Timestamp of event occurrence |
| deviceId | Equipment identifier |
| device | Name of the equipment |
| variableId | Identifier of the variable |
| variable | Name of the variable |
| variableCategories | Categories of the variable |
| label | Name of the event |
| action | Action of the event (change from this value to that value) |
By default, all values will be returned with all fields sorted in chronological order of event occurrence.
An example of an HTTP request is:
https://192.168.1.223/events?limit=2&field[]=variableId&field[]=timeThe code written in Python will be as follows:
query = 'events?'
query += urlencode({'limit': 2, 'field[]': ['variableId', 'time']}, doseq=True)
req = requests.get(SERVER_URI + requote_uri(query), headers={
        'Authorization': 'Bearer {api_key}'.format(api_key=API_KEY)
    })
if req.status_code == 200:
    print('OK')
    data = req.json()
    print(data)
else:
    print('ERR:', req.json())
The answer to this query is:
{'items': [{'variableId': '62238', 'time': -1755053102}, {'variableId': '62268', 'time': -1755053102}], 'cursor': '{"field":["variableId","time"],"lastValues":[-1755053102,"62268"]}'}3.2.2.5 Historical values
To get the list of historical values, the HTTP request will be:
/plot-values?This query can be given several additional parameters in order to get more precise information. Parameters that will only take one value are identified by param=VALUE and parameters that can take a list of values are identified by param[]=VALUES:
| Paramètre | Description |
| limit=VALUE | Maximum number of items (VALUE) to be returned |
| sort=VALUE(,asc ou sort[]=VALUES | Sorting on VALUE in an ascending (,asc) or descending (,desc) manner. It is possible to sort on several VALUE fields |
| field=VALUE ou field[]=VALUES | Sorting on VALUE in an ascending (,asc) or descending (,desc) manner. It is possible to sort on several VALUE fields |
| search=VALUE | Filtering on the desired VALUE field or fields |
| search~x=VALUE | Returns only items where any field contains the text VALUE |
| cursor=VALUE | Value of the ‘cursor’ field returned in the last query with the limit=VALUE parameter set to obtain the sequence of items |
| avgValues=VALUE | Returns averaged values (VALUE=1) or not (VALUE=0). By default, the values are not averaged. |
| nbValues=VALUE | Returns VALUE values with an equal time step between values |
| champ=VALUE | Returns only those items whose specified fields have a value equal to the specified VALUE. |
| champ~x=VALUE | Returns only those items whose specified fields do not have a value equal to the specified VALUE. |
| champ~s=VALUE | Returns only those items whose specified fields have a value containing the specified VALUE. |
| champ~sx=VALUE | Returns only those items whose specified fields do not have a value containing the specified VALUE. |
| champ~i=VALUE | Returns only those items whose specified fields contain a value within the specified range as ‘[‘ or ‘]’ followed by {min-value}, then ‘;’, then {max-value}, then ‘]’ or ‘[‘. |
| champ~ix=VALUE | Returns only those items whose specified fields contain a value that is not within the specified range as ‘[‘ or ‘]’ followed by {min-value}, then ‘;’, then {max-value}, then ‘]’ or ‘[‘. |
Note
It is important to know that it is essential to set the parameters variableId=VALUE, 'time~i'=[...;...] and nbValues=VALUE to obtain historical values. If we do not put one of these parameters then no historical value will be returned.
| Name of the field | Description |
| time | Timestamp for storing the value |
| rawValue | Gross value of the variable |
| displayValue | Truncated value of the variable |
An example of an HTTP request is:
https://192.168.1.223/plot-values?variableID=19212&time~i=[1634680800; 1653516000[&nbValues=10&avgValues=1&sort=time,ascThe code written in Python will be as follows:
query = 'plot-values?'
query += urlencode({'variableId': 19212, 'time~i': '[1634680800; 1653516000[', 'nbValues': 10, 'avgValues': 1, 'sort': 'time,asc', 'limit': 5, 'displayValue~x':'2.099'})
req = requests.get(SERVER_URI + requote_uri(query), headers={
        'Authorization': 'Bearer {api_key}'.format(api_key=API_KEY)
    })
if req.status_code == 200:
    print('OK')
    data = req.json()
    print(data)
else:
    print('ERR:', req.json())
The answer to this query is:
{"items":[{"time":1638447840,"rawValue":2823.39497961264,"displayValue":"2823.395"},{"time":1640331360,"rawValue":4458.263155687225,"displayValue":"4458.263"},{"time":1642214880,"rawValue":2.2232299099558275,"displayValue":"2.223"},{"time":1644098400,"rawValue":12454.150091318386,"displayValue":"12454.15"},{"time":1645981920,"rawValue":6610.666512168708,"displayValue":"6610.667"}],
"cursor":"{\"variableId\":\"19212\",\"time~i\":\"[1634680800; 1653516000[\",\"nbValues\":\"10\",\"avgValues\":\"1\",\"sort\":\"time,asc\",\"displayValue~x\":\"2.099\",\"lastValues\":[1645981920]}"}
3.2.2.6 Historical counters
To get the list of historical counters, the HTTP request will be:
/diff-values?This query can be given several additional parameters in order to get more precise information. Parameters that will only take one value are identified by param=VALUE and parameters that can take a list of values are identified by param[]=VALUES:
| Paramètre | Description |
| limit=VALUE | Maximum number of items (VALUE) to be returned |
| sort=VALUE(,asc ou sort[]=VALUES | Sorting on VALUE in an ascending (,asc) or descending (,desc) manner. It is possible to sort on several VALUE fields |
| field=VALUE ou field[]=VALUES | Sorting on VALUE in an ascending (,asc) or descending (,desc) manner. It is possible to sort on several VALUE fields |
| search=VALUE | Filtering on the desired VALUE field or fields |
| search~x=VALUE | Returns only items where any field contains the text VALUE |
| cursor=VALUE | Value of the ‘cursor’ field returned in the last query with the limit=VALUE parameter set to obtain the sequence of items |
| avgValues=VALUE | Returns averaged values (VALUE=1) or not (VALUE=0). By default, the values are not averaged. |
| nbValues=VALUE | Returns VALUE values with an equal time step between values |
| champ=VALUE | Returns only those items whose specified fields have a value equal to the specified VALUE. |
| champ~x=VALUE | Returns only those items whose specified fields do not have a value equal to the specified VALUE. |
| champ~s=VALUE | Returns only those items whose specified fields have a value containing the specified VALUE. |
| champ~sx=VALUE | Returns only those items whose specified fields do not have a value containing the specified VALUE. |
| champ~i=VALUE | Returns only those items whose specified fields contain a value within the specified range as ‘[‘ or ‘]’ followed by {min-value}, then ‘;’, then {max-value}, then ‘]’ or ‘[‘. |
| champ~ix=VALUE | Returns only those items whose specified fields contain a value that is not within the specified range as ‘[‘ or ‘]’ followed by {min-value}, then ‘;’, then {max-value}, then ‘]’ or ‘[‘. |
Note
It is important to know that it is essential to set the parameters variableId=VALUE, time~i=[...;...] and nbValues=VALUE to obtain historical values. If you don't set one of these parameters then no historical value will be returned.
| Name of field | Description |
| time | Timestamp for storing the value |
| rawValue | Gross value of the variable |
| displayValue | Truncated value of the variable |
An example of an HTTP request is:
https://192.168.1.223/diff-values?variableId=19212&nbValues=4&time~i=[1634680800; 1653516000[The code written in python will be as follows:
query = 'diff-values?'
query += urlencode({'variableId': 19212, 'time~i': '[1634680800; 1653516000[', 'nbValues': 4})
req = requests.get(SERVER_URI + requote_uri(query), headers={
        'Authorization': 'Bearer {api_key}'.format(api_key=API_KEY)
    })
if req.status_code == 200:
    print('OK')
    data = req.json()
    print(data)
else:
    print('ERR:', req.json())
The answer to this query is:
{'items': [{'time': 1640959200, 'rawValue': 545510, 'displayValue': '545510'}, {'time': 1647237600, 'rawValue': 1035737, 'displayValue': '1035737'}, {'time': 1653516000, 'rawValue': 109394, 'displayValue': '109394'}]}3.2.2.7 Raw historical data
To get the raw history list, the HTTP request will be:
/log-entries?Warning This request should be used with caution as it allows the raw data to be sent to another server.
This query can be given several additional parameters in order to get more precise information. Parameters that will only take one value are identified by param=VALUE and parameters that can take a list of values are identified by param[]=VALUES:
| Parameters | Description |
| limit=VALUE | Maximum number of items (VALUE) to be returned |
| sort=VALUE(,asc/desc) or sort[]=VALUES(,asc/desc) | Sorting on VALUE in an ascending (,asc) or descending (,desc) manner. It is possible to sort on several VALUE fields |
| field=VALUE or field[]=VALUES | Filtering on the desired VALUE field or fields |
| search=VALUE | Returns only items where any field contains the text VALUE |
| search~x=VALUE | Returns only items where any field does not contain the text VALUE |
| cursor=VALUE | Value of the ‘cursor’ field returned in the last query with the limit=VALUE parameter set to obtain the sequence of items |
| champ=VALUE | Returns only those items whose specified fields have a value equal to the specified VALUE. |
| champ~x=VALUE | Returns only those items whose specified fields do not have a value equal to the specified VALUE. |
| champ~s=VALUE | Returns only those items whose specified fields have a value containing the specified VALUE. |
| champ~sx=VALUE | Returns only those items whose specified fields do not have a value containing the specified VALUE. |
| champ~i=VALUE | Returns only those items whose specified fields contain a value within the specified range as ‘[‘ or ‘]’ followed by {min-value}, then ‘;’, then {max-value}, then ‘]’ or ‘[‘. |
| champ~ix=VALUE | Returns only those items whose specified fields contain a value that is not within the specified range as ‘[‘ or ‘]’ followed by {min-value}, then ‘;’, then {max-value}, then ‘]’ or ‘[‘. |
| Name of the field | Description |
| id | Identifier of the stored value |
| time | Timestamp for storing the value |
| variableId | Identifier of the variable |
| variable | Name of the variable |
| deviceId | Equipment identifier |
| type | Type of the stored value |
| value | Value of the variable at this timestamp |
An example of an HTTP request is:
https://192.168.1.223/log-entries?variableId=19212&time~i=[1634680800; 1653516000[&limit=2The code written in Python will be as follows:
query = 'log-entries?'
query += urlencode({'variableId': 19212, 'time~i': '[1634680800; 1653516000[', 'limit':2})
req = requests.get(SERVER_URI + requote_uri(query), headers={
        'Authorization': 'Bearer {api_key}'.format(api_key=API_KEY)
    })
if req.status_code == 200:
    print('OK')
    data = req.json()
    print(data)
else:
    print('ERR:', req.json())
The answer to this query is:
{'items': [{'id': '35441586', 'time': 1634710517, 'variableId': '19212', 'variable': 'test', 'deviceId': '17280001', 'device': 'Courtois', 'type': 'plot-value', 'value': 1}, {'id': '35498207', 'time': 1634749884, 'variableId': '19212', 'variable': 'test', 'deviceId': '17280001', 'device': 'Courtois', 'type': 'plot-value', 'value': 3}], 'cursor': '{"variableId":"19212","time~i":"[1634680800; 1653516000[","lastValues":["35498207"]}'}3.2.3 POST method
This method is used to create a new entry in a table. To do this, you must select the table you want to modify and then define the key/value pairs of the element you want to create.
3.2.3.1 Variables
To create a new variable, the HTTP request will be:
/variablesThis query will be followed by a dictionary whose ‘item’ key itself contains a dictionary containing the keys/values of some of the fields in the variable:
{'item': {'deviceId': ..., 'device': ..., 'displayLabel': ..., ...}Thus, the following keys can be filled in with values:
| Name of the field | Description |
| deviceId | Equipment identifier |
| device | Name of the equipment |
| displayLabel | Value of the representation of the variable |
| addres | Address of the variable |
| type | Type of variable |
| intRegister | Address of the variable |
| priority | Priority of the variable |
| mnemonic | Mnemonic of the variable |
| label | Name of the variable |
| comment | Comment |
| isInternal | Boolean indicating whether the variable is internal or not |
| isPublic | Boolean indicating whether the variable is public or not |
| isWriteable | Boolean indicating whether the variable can be written or not |
| minWriteValue | Minimum value that the variable can take |
| maxWriteValue | Maximum value that the variable can take |
| categories | Categories to which the variable belongs |
| format | Format of the variable |
| floatPrecision | Integer indicating the number of significant digits after the decimal point. 0 if the variable is not a decimal. |
| unit | Unit of the variable. If no unit then ” is returned. |
| minRemoteScaleValue | Minimum gross value |
| maxRemoteScaleValue | Maximum gross value |
| minLocalScaleValue | Minimum value when scaling |
| maxLocalScaleValue | Maximum value when scaling |
| inhibitionUser | User who has disabled the alarm |
| inhibitionStartTime | Start date of inhibition |
| inhibitionStopTime | End date of inhibition |
| hasAlarm | Boolean to enable alarm management |
| alarmLabel | Alarm label |
| alarmCondition | Alarm condition |
| hasEvent | Boolean allowing event management |
| eventLabel | Name of the event |
| eventCondition | Condition of the event |
| hasPlot | Boolean to allow historical values |
| plotIsAveraged | Boolean allowing to average the curve |
| plotMinDelay | Time between two points in seconds on the curve |
| plotMinDiff | Hysteresis of the variable |
| snmpOID | SNMP address of the variable |
| snmpType | SNMP type of the variable |
| rawValue | Current value of the variable |
| displayValue | Formatted value of the variable |
Information
There is no obligation to fill in all the fields to create a variable and there are no mandatory fields to fill in, but the more fields filled in, the more accurate the information on the variable will be.
An example of an HTTP request is:
https://192.168.1.223/mserver/ui/api/v1/variables with the parameters:
{'item': {'label': 'temperature', 'deviceId': 2}The code written in Python will be as follows:
query = 'variables'
data = {'item' : json.dumps(
    {
        'label': 'temperature',
        'deviceId': 2}, sort_keys=True)}
req = requests.post(SERVER_URI + requote_uri(query), data = data, headers={
        'Authorization': 'Bearer {api_key}'.format(api_key=API_KEY)
    })
print(req.json())
Once the variable is created, the output (req.json()) displays the variable’s ID in the database (id field).
3.2.3.2 Equipment
To create a new equipment, the HTTP request will be:
/devicesThis query will be followed by a dictionary whose ‘item’ key itself contains a dictionary containing the keys/values of some of the fields in the variable:
{'item': {'isActive': ..., 'type': ..., 'name': ..., ...}Thus, the following keys can be filled in with values:
| Name of the field | Description |
| isActive | Boolean indicating whether the equipment is active (1) or in error (0) |
| type | Type of equipment |
| name | Name of the equipment |
| comment | Comment |
| displayLabel | Value of the representation of the equipment |
| zones | Area(s) of the equipment |
| purgeDelay | Time to purge history (in days) |
| timeout | Timeout (in seconds) |
| refreshDelay | Refresh time (in seconds) |
| comProtocol | Communication protocol used |
| comPort | Communication port used |
| slaveNumber | Slave number. None for none. |
| password | Equipment password |
| comState | Communication status |
| alarms | Number of active alarms |
| isEditable | Boolean indicating whether the equipment is modifiable by a user |
Information
There is no obligation to fill in all the fields to create a piece of equipment and there are no mandatory fields to fill in, but the more fields filled in, the more accurate the information on the equipment will be.
An example of an HTTP request is:
https://192.168.1.223/mserver/ui/api/v1/variables with the parameters:
{'item': {'label': 'temperature', 'deviceId': 2}The code written in Python will be as follows:
query = 'devices'
data =  {'item' : json.dumps(
    {
        'name': 'Equipement_test',
        'comment': 'Ceci est un test'}, sort_keys=True)}
req = requests.post(SERVER_URI + requote_uri(query), data = data, headers={
        'Authorization': 'Bearer {api_key}'.format(api_key=API_KEY)
    })
print(req.json())
Once the equipment has been created, the output (req.json()) displays the equipment identifier in the database (id field).
3.2.4 PATCH method
This method is used to modify an element in a table.
3.2.4.1 Variables
To change a variable, the HTTP request will be:
/variables/{id}With ‘id’ corresponding to the index of the variable in the database. This query will be followed by a dictionary whose ‘item’ key itself contains a dictionary containing the keys/values of some of the fields in the variable:
{'item': {'deviceId': ..., 'device': ..., 'displayLabel': ..., ...}Thus, the following keys can be filled in or modified with values:
| Name of the field | Description |
| deviceId | Equipment identifier |
| device | Name of the equipment |
| displayLabel | Value of the representation of the variable |
| addres | Address of the variable |
| type | Type of variable |
| intRegister | Address of the variable |
| priority | Priority of the variable |
| mnemonic | Mnemonic of the variable |
| label | Label of the variable |
| comment | Comment |
| log | Boolean indicating whether the modification of the variable raises an event or not |
| isInternal | Boolean indicating whether the variable is internal or not |
| isPublic | Boolean indicating whether the variable is public or not |
| isWriteable | Boolean indicating whether the variable can be written or not |
| minWriteValue | Minimum value that the variable can take |
| maxWriteValue | Maximum value that the variable can take |
| categories | Categories to which the variable belongs |
| format | Format of the variable |
| floatPrecision | Integer indicating the number of significant digits after the decimal point. 0 if the variable is not a decimal. |
| unit | Unit of the variable. If no unit then ” is returned. |
| minRemoteScaleValue | Minimum gross value |
| maxRemoteScaleValue | Maximum gross value |
| minLocalScaleValue | Minimum value when scaling |
| maxLocalScaleValue | Maximum value when scaling |
| inhibitionUser | User who has disabled the alarm |
| inhibitionStartTime | Start date of inhibition |
| inhibitionStopTime | Date de fin dEnd date of inhibitione l’inhibition |
| hasAlarm | Boolean to enable alarm management |
| alarmLabel | Alarm label |
| alarmCondition | Alarm condition |
| hasEvent | Boolean allowing event management |
| eventLabel | Name of the event |
| eventCondition | Condition of the event |
| hasPlot | Boolean to allow historical values |
| plotIsAveraged | Boolean allowing to average the curve |
| plotMinDelay | Time between two points in seconds on the curve |
| plotMinDiff | Hysteresis of the variable |
| snmpOID | SNMP address of the variable |
| snmpType | SNMP type of the variable |
| rawValue | Current value of the variable |
| displayValue | Formatted value of the variable |
An example of an HTTP request is:
https://192.168.1.223/mserver/ui/api/v1/variables with the parameters:
{'item': {'label': 'temperature', 'deviceId': 2}The code written in Python will be as follows:
query = 'variables'
data =  {'item' : json.dumps(
    {
        'label': 'temperature',
        'deviceId': 2}, sort_keys=True)}
req = requests.patch(SERVER_URI + requote_uri(query), data = data, headers={
        'Authorization': 'Bearer {api_key}'.format(api_key=API_KEY)
    })
print(req.json())
Once the variable is modified, the output (req.json()) displays None.
Information
For string variables (MS), it is essential to encode the value contained in the rawValue field in a JSON using the json.dumps() function.
For example:
data = { 'item' : json.dumps(
    {
        label': 'url',
        'rawValue': json.dumps('https://test.fr')}, sort_keys=True)}
3.2.4.2 Equipment
To modify a device, the HTTP request will be:
/devices/{id}With ‘id’ corresponding to the index of the equipment in the database. This query will be followed by a dictionary whose key ‘item’ itself contains a dictionary containing the keys/values of some of the fields in the variable:
{'item': {'isActive': ..., 'type': ..., 'name': ..., ...}Thus, the following keys can be filled in with values:
| Name of the field | Description |
| isActive | Boolean indicating whether the equipment is active (1) or in error (0) |
| type | Type of equipment |
| name | Name of the equipment |
| comment | Comment |
| displayLabel | Value of the representation of the equipment |
| zones | Area(s) of the equipment |
| purgeDelay | Time to purge history (in days) |
| timeout | Timeout (in seconds) |
| refreshDelay | Refresh time (in seconds) |
| comProtocol | Communication protocol used |
| comPort | Communication port used |
| slaveNumber | Slave number. None for none. |
| password | Equipment password |
| comState | Communication status |
| alarms | Number of active alarms |
| isEditable | Boolean indicating whether the equipment is modifiable by a user |
An example of an HTTP request is:
https://192.168.1.223/mserver/ui/api/v1/variables with the parameters:
{'item': {'label': 'temperature', 'deviceId': 2}The code written in python will be as follows:
query = 'devices'
data = {'item' : json.dumps(
    {
        'name': 'Equipement_test',
        'comment': 'Ceci est un test'}, sort_keys=True)}
req = requests.patch(SERVER_URI + requote_uri(query), data = data, headers={
        'Authorization': 'Bearer {api_key}'.format(api_key=API_KEY)
    })
print(req.json())
Once the equipment has been modified, the output (req.json()) displays None.
3.2.5 DELETE method
This method is used to delete an item from a table.
3.2.5.1 Variables
To delete a variable from a table, the HTTP request will be:
/variables/{id}With ‘id’ corresponding to the index of the variable in the database. No parameters are needed.
3.2.5.1 Equipments
To delete a variable from a table, the HTTP request will be:
/devices/{id}With ‘id’ corresponding to the index of the variable in the database. No parameters are required.